The QuantiSlakeTest (QST)
Starting point for ressources, documentations
Table of Contents
- 1. Slake at first sight
- 2. Main contributors
- 3. Main protocol and visualization of the effect on scales
- 4. Slaking Lab
- 5. What's going in the early phase and main indicators available
- 6. Softwares
- 7. Publications
- 8. Vidéos
- 9. Partners
- 9.1. Farmer's association
- 9.2. Academic
- 9.3. Projects
- 9.3.1. PIRAT, F.Vanwindekens (initial development of the experiment & protocol)
- 9.3.2. MicroSoilSystem, B.Hardy, (farmers' network)
- 9.3.3. Sol Plateformes (Gembloux), B.Hardy, S.Sail, M.Abras (SYCI, SYCBIO, SYCMA)
- 9.3.4. Sol LTE (Gembloux), S.Sail, B.Hardy,
- 9.3.5. SPOT (Libramont), M.Mathot
- 9.3.6. AgroEcologyTransect, A.Fockedey
- 9.3.7. Wallonie Agriculture de Conservation (WAC), M.Ferdinand (farmers'network)
- 9.3.8. Erosion Betterave (EroBet), Greenotec Team (farmers'network)
- Bibliographie
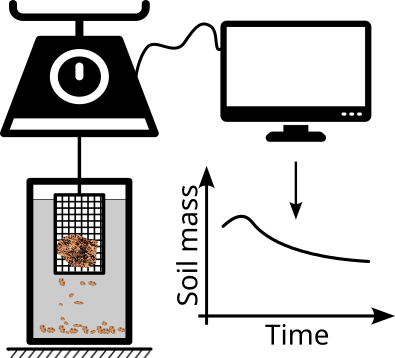
The QuantiSlakeTest (QST) is a recently launched simple test to evaluate soil structural stability. It consists in a quantitative approach of the slake test, a dynamic weighing of a dried structured soil sample once immersed in water.
1. Slake at first sight
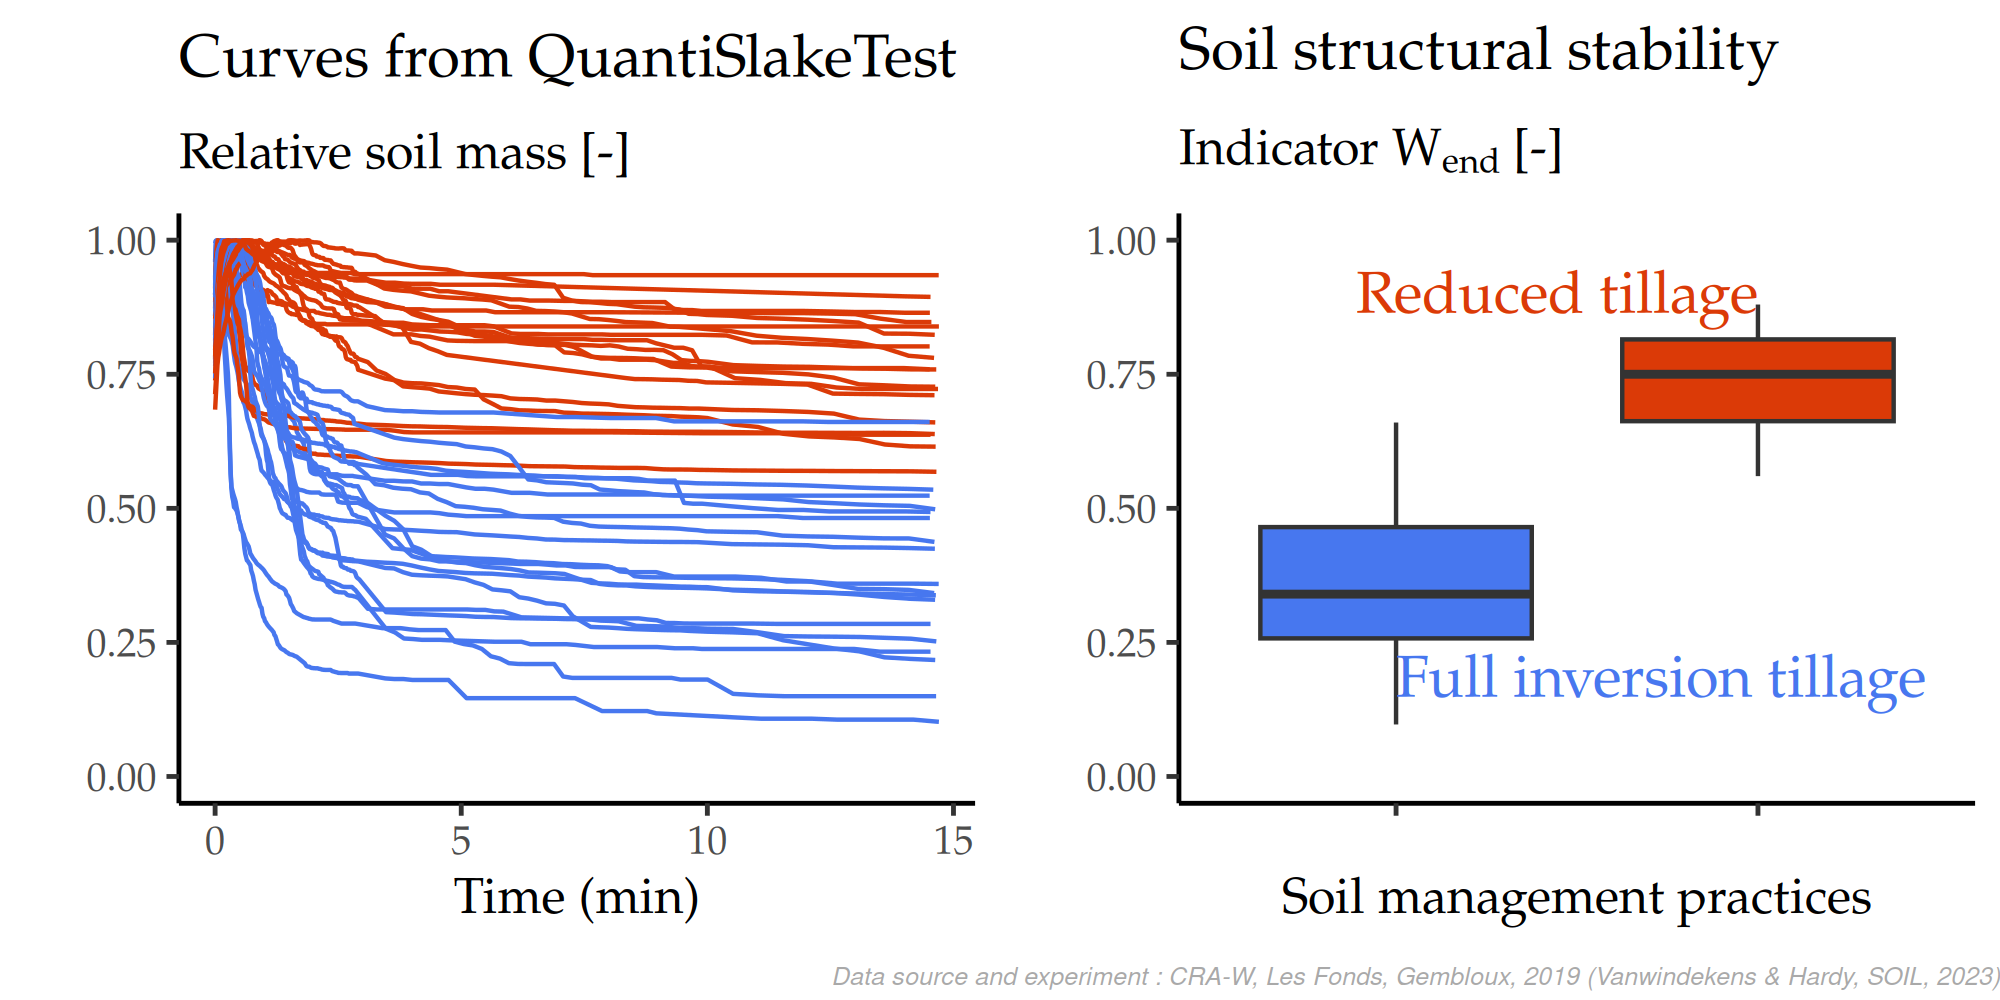
QST curves and final relative mass (Wend) for full inversion tillage and reduced tillage treatments of a tillage long term expirment in Gembloux.
2. Main contributors
- Chrisian Roisin :
- Initial idea to build a quantification of the qualitive slake test for soil structural stability
- Scientific support for indicators
- Frédéric Vanwindekens
- Idea of a quantification using a digital scale, undeweighting and computer recording
- Development of the protocol
- Development of the functions, the software and the web application (slaker)
- Main technical contact for using the SlakingLab, sharing and diffusing the approach in other institutions
- Brieuc Hardy
- Main scientific support for interpretation and link to soil properties (bio., physical & chemical)
- Author of the seminal paper published in Soil journal in 2023 (see Bibliography section)
- CRA-W / D3 / U7 : Bruno Huyghebaert, Morgan Abras, Simon Sail, Antoine Motet
- Administrative support
- Field support during sampling
- Students
- …
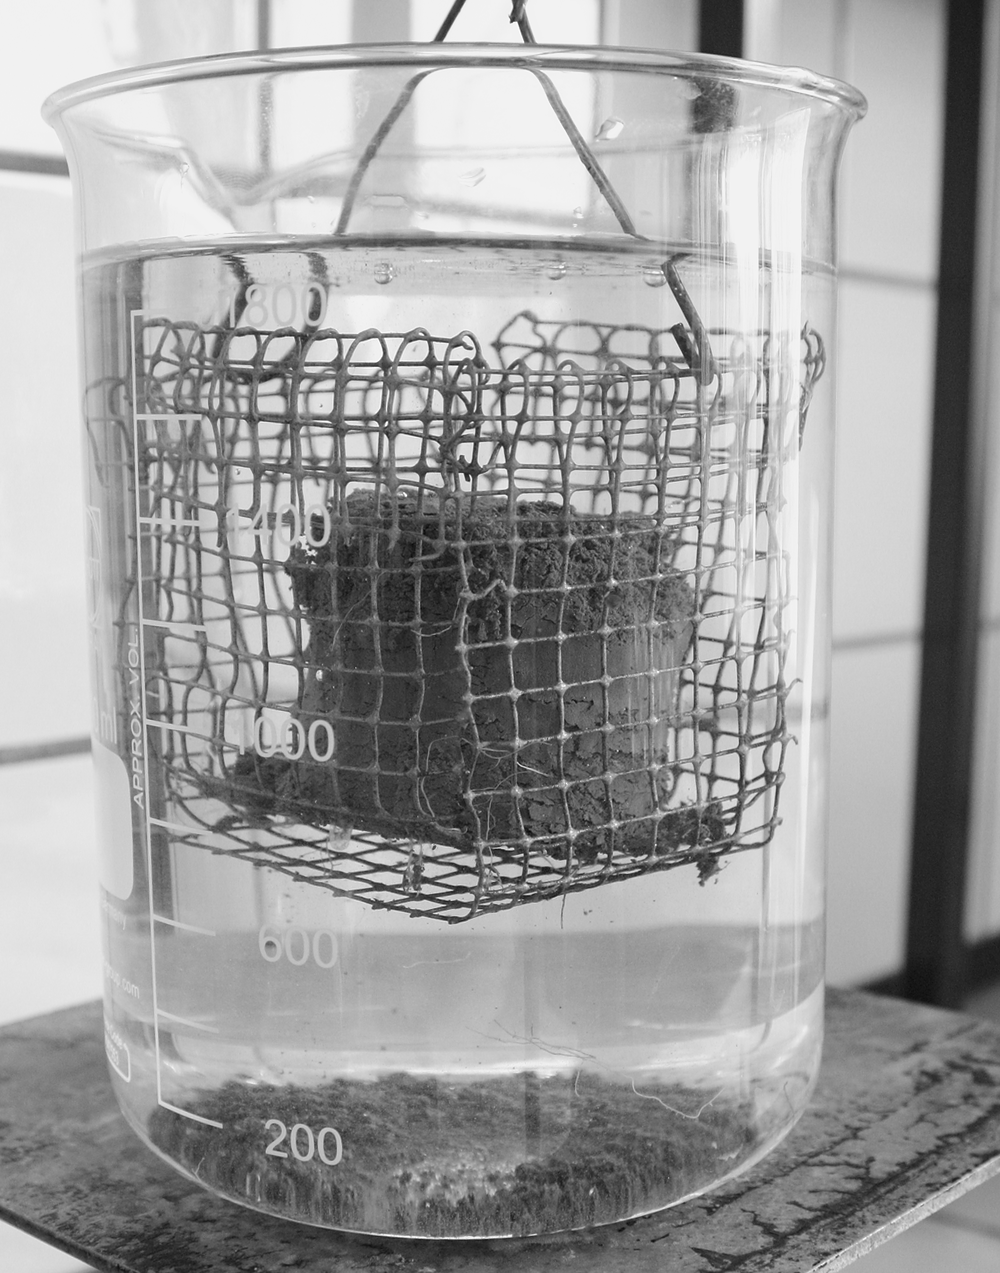
3. Main protocol and visualization of the effect on scales
3.1. Visualization
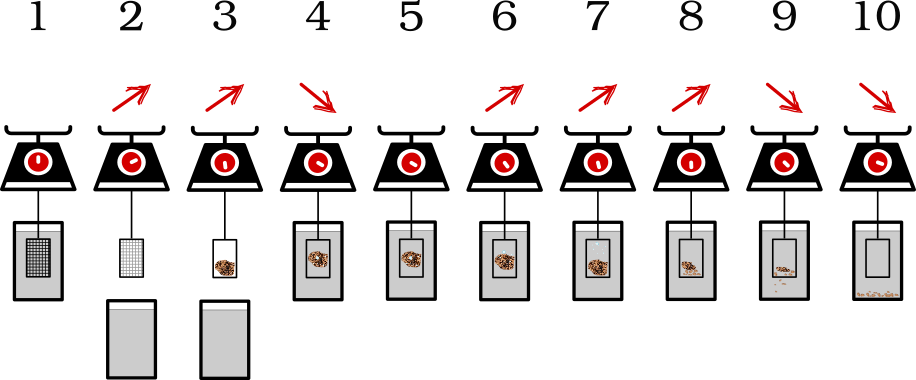
3.2. Modus operandi of the slake test (in your labs) :
- Launch the program (see 'Computer' section)
- Turn on the scale and check that it is level (bubble level)
- Put distilled water in the berlin (1400 ml for transparent berlin, up to the mark for opaque berlin)
- Position the empty basket suspended from the scale in the water
- Tare the scale (= STEP 1 here above)
- Remove the berlin (= STEP 2 here above)
- Place the sample in the basket (= STEP 3 here above)
- Once the sample number is correctly established in the application click on 'Start the Slaketest'.
- When the graph begins to be constructed, quickly replace the basket with the sample in the water, making sure that the basket does not touch the edges (= STEP 4 here above)
- QuantiSlakeTest is going on = STEPS 5 to 9 here above
- Once the slaketest is finished (when the slope is relatively nil, usually from 1000s), click on 'Stop the Slaketest'. Wait for the graph to disappear (this may take some iteration(s)) (= STEP 10 here above)
- /!\ NOT SURE /!\ To limit the risk of bugs, it is better to switch the scales off and on again between each test.
4. Slaking Lab
4.1. Scale properties (min requirements)
- d
- 0.01 g
- data
- (usb-c, Serial, … live export to computer)
- max
- at least 500g (100cm³ of soil sample, so often <200g ).
- hook
- for under scale
4.2. Ex. in the lab : (old, Kern sériePCB)
- max
- 1000 or 1200 g
- d
- 0.01 g
- other features
- hook for "under scale" measure-balance
- Connexion "Serial" to USB.
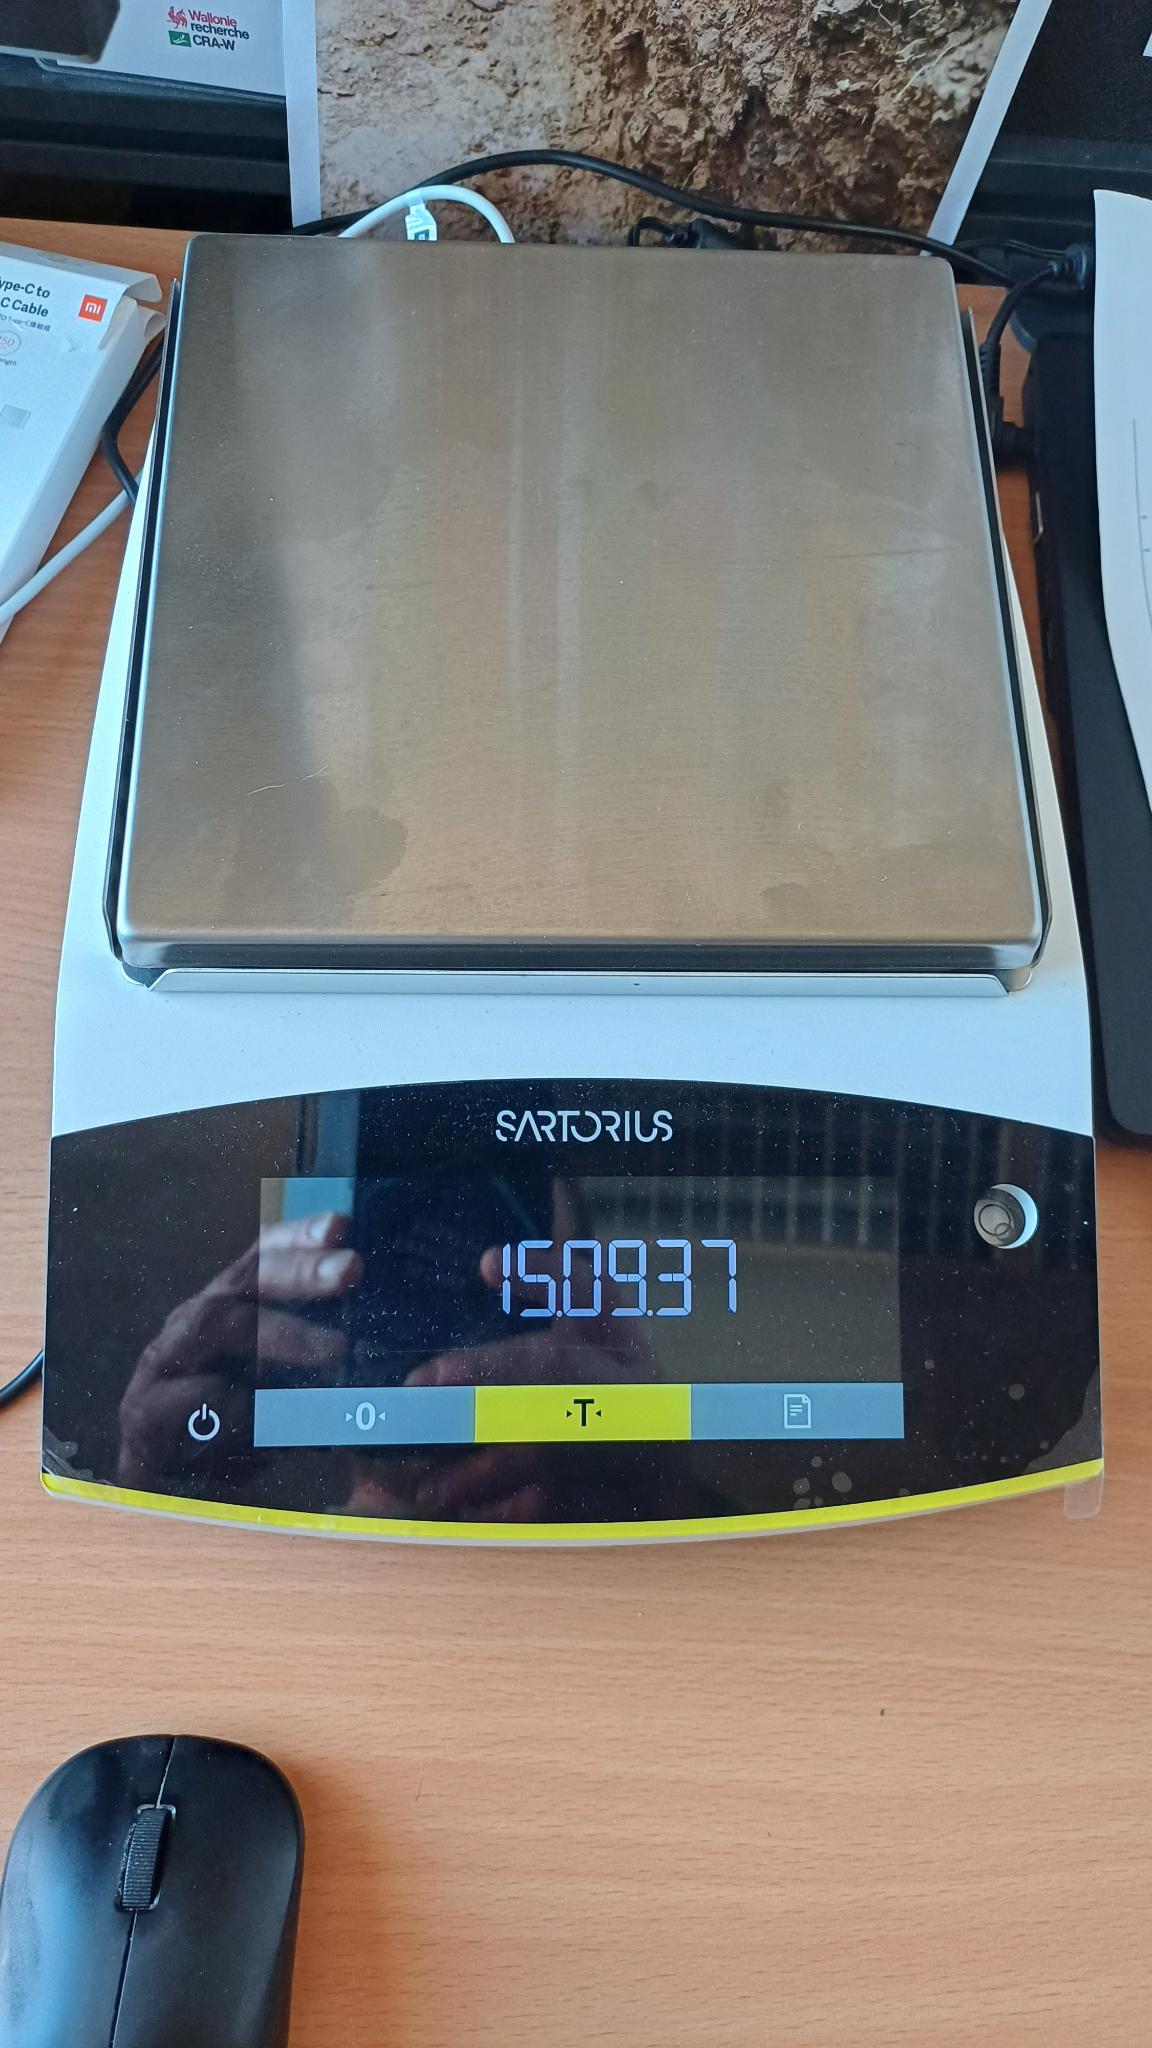
4.3. Scale New (Sartorius, BCE622I-1S)
- max
- 620
- d
- 10 mg (;-) )
- other features
- hook for "under scale" measure-balance
- Connexion usb-c to usb-c (new computer !)
4.4. Equipment
4.4.1. Geometric dimensioning and tolerancing
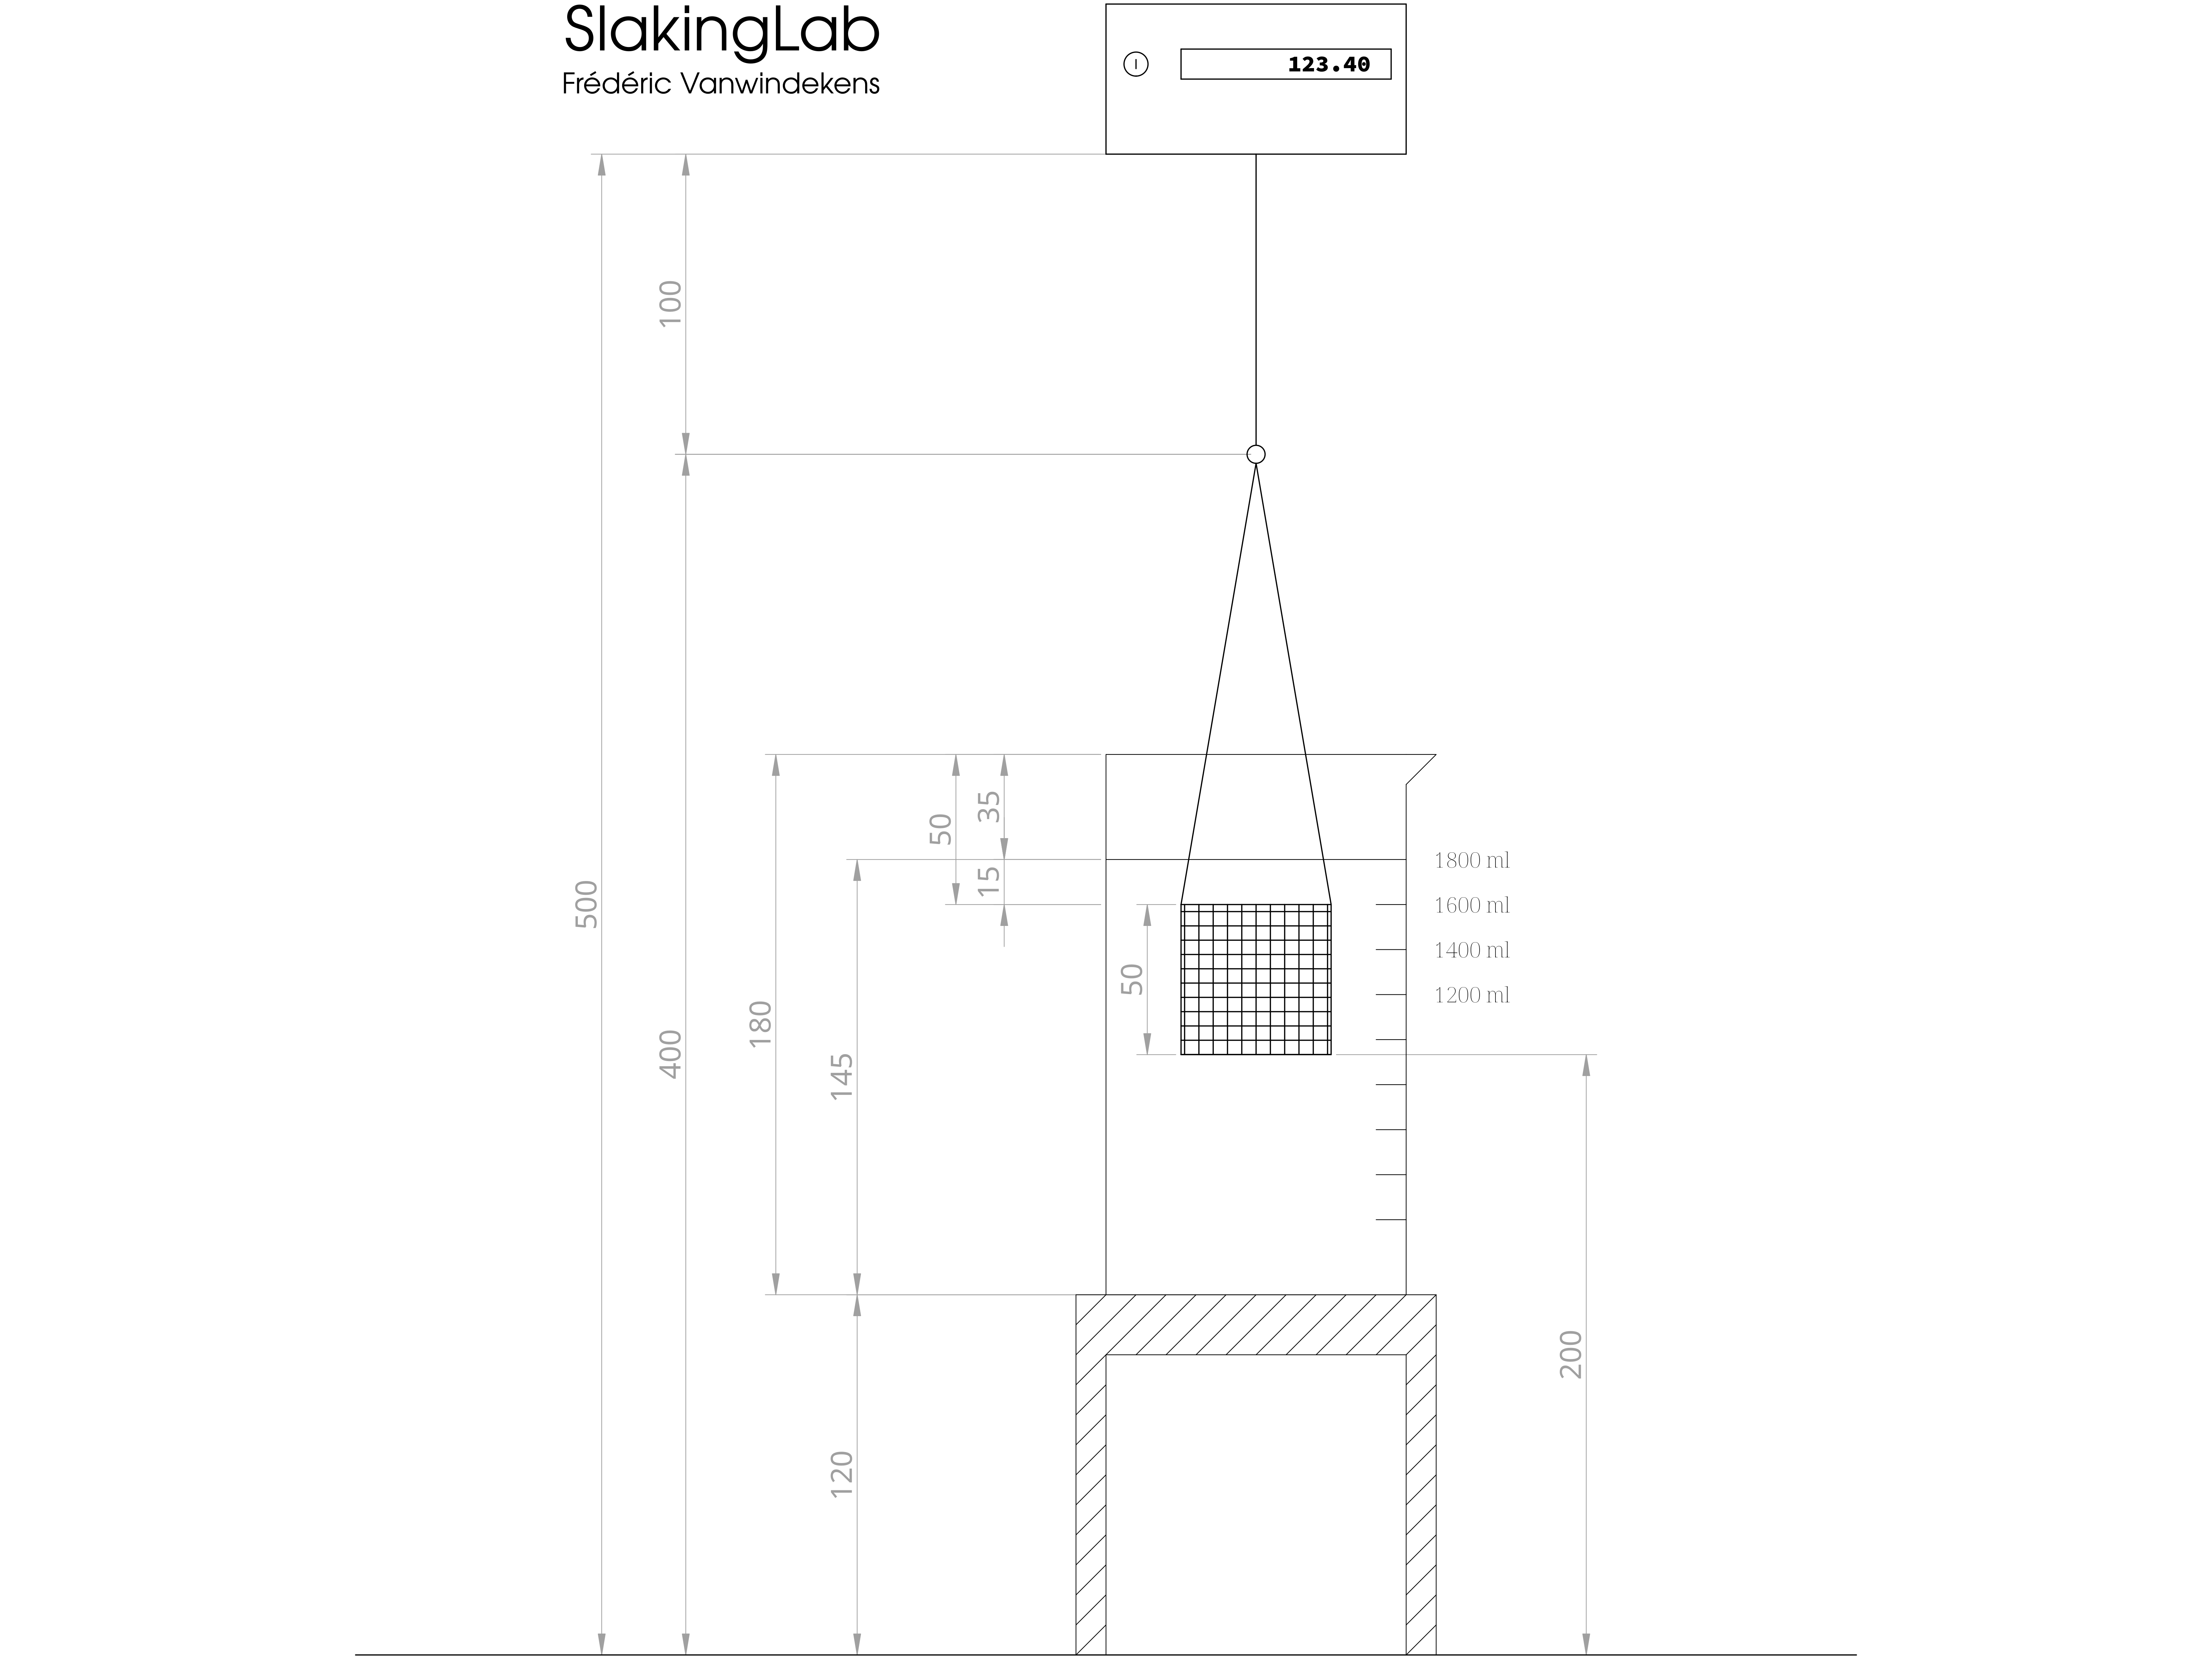
Figure 1: Geometric dimensioning and tolerancing of the SlakingLab
4.4.2. Details
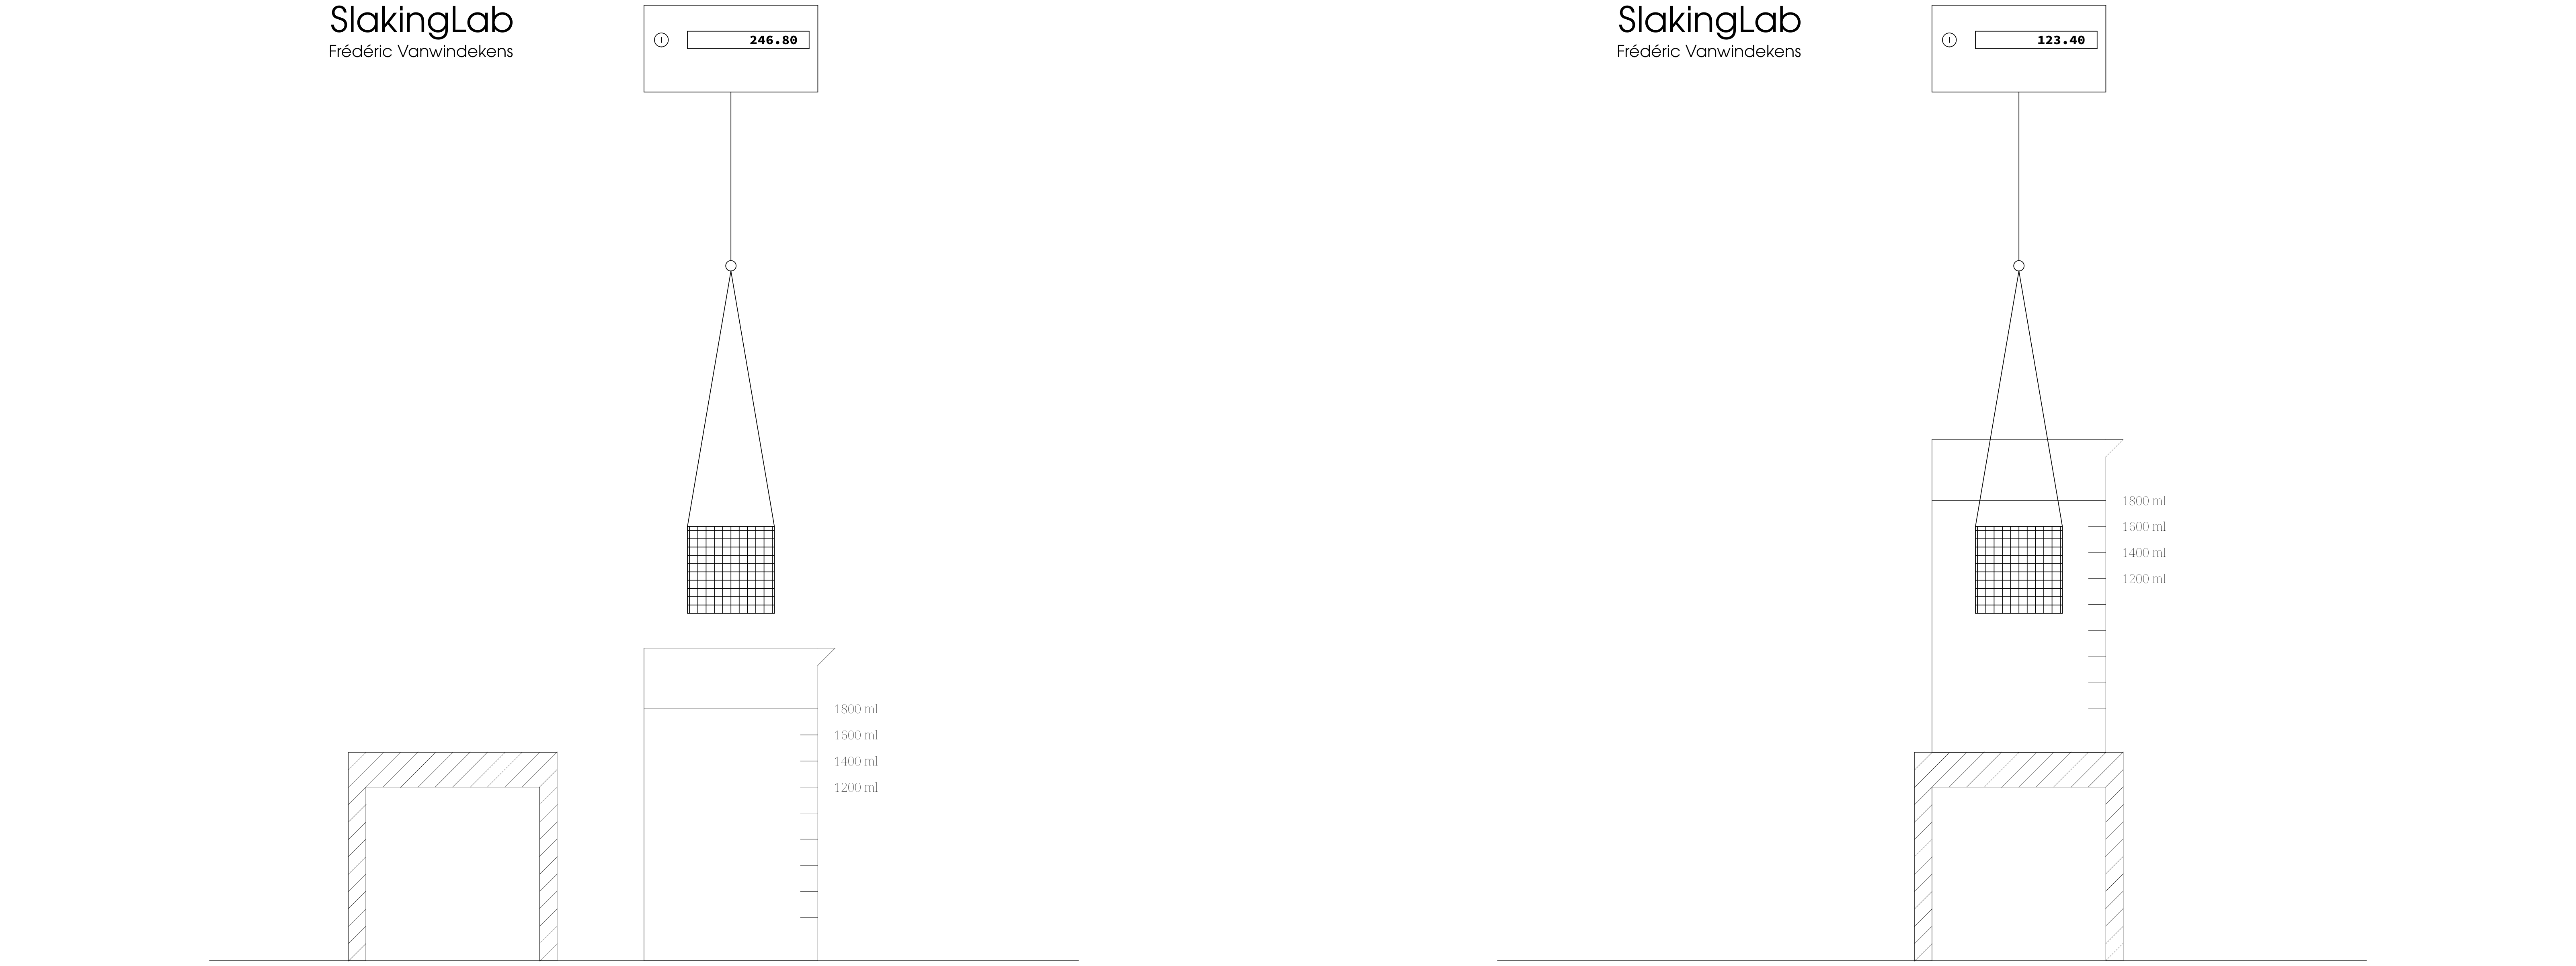
Figure 2: Main positions of moving parts of the SlakingLab
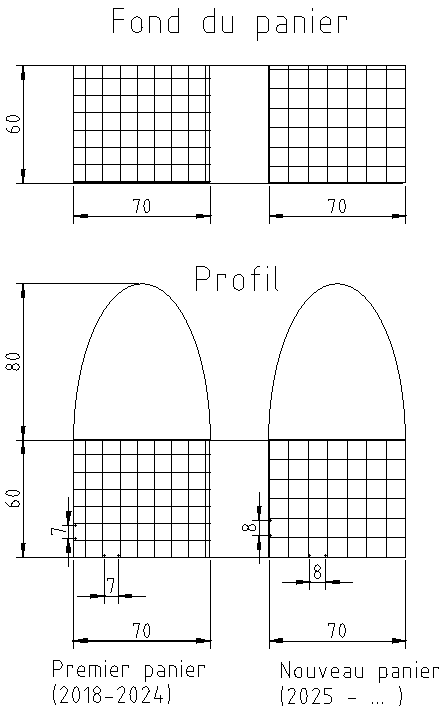
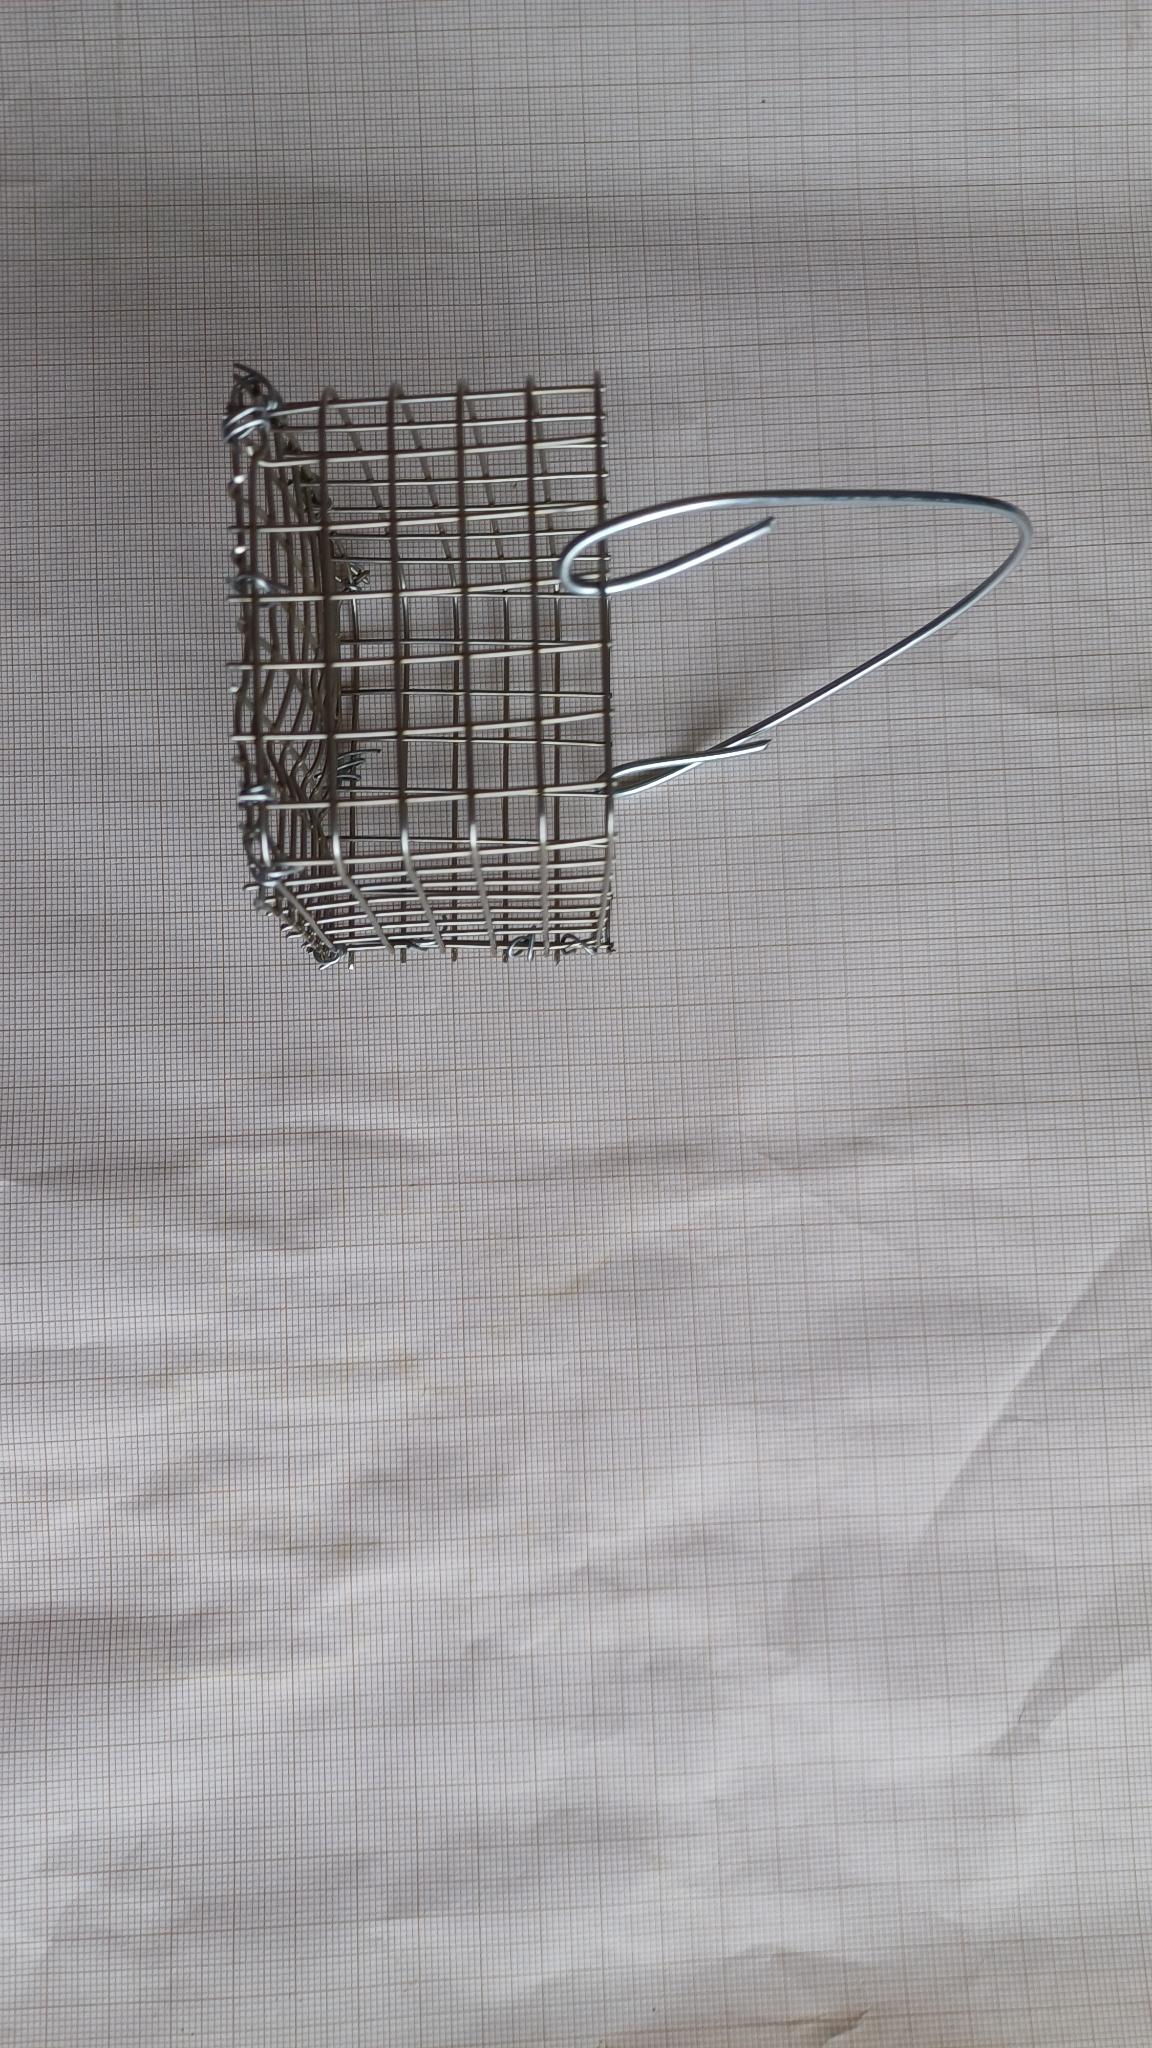
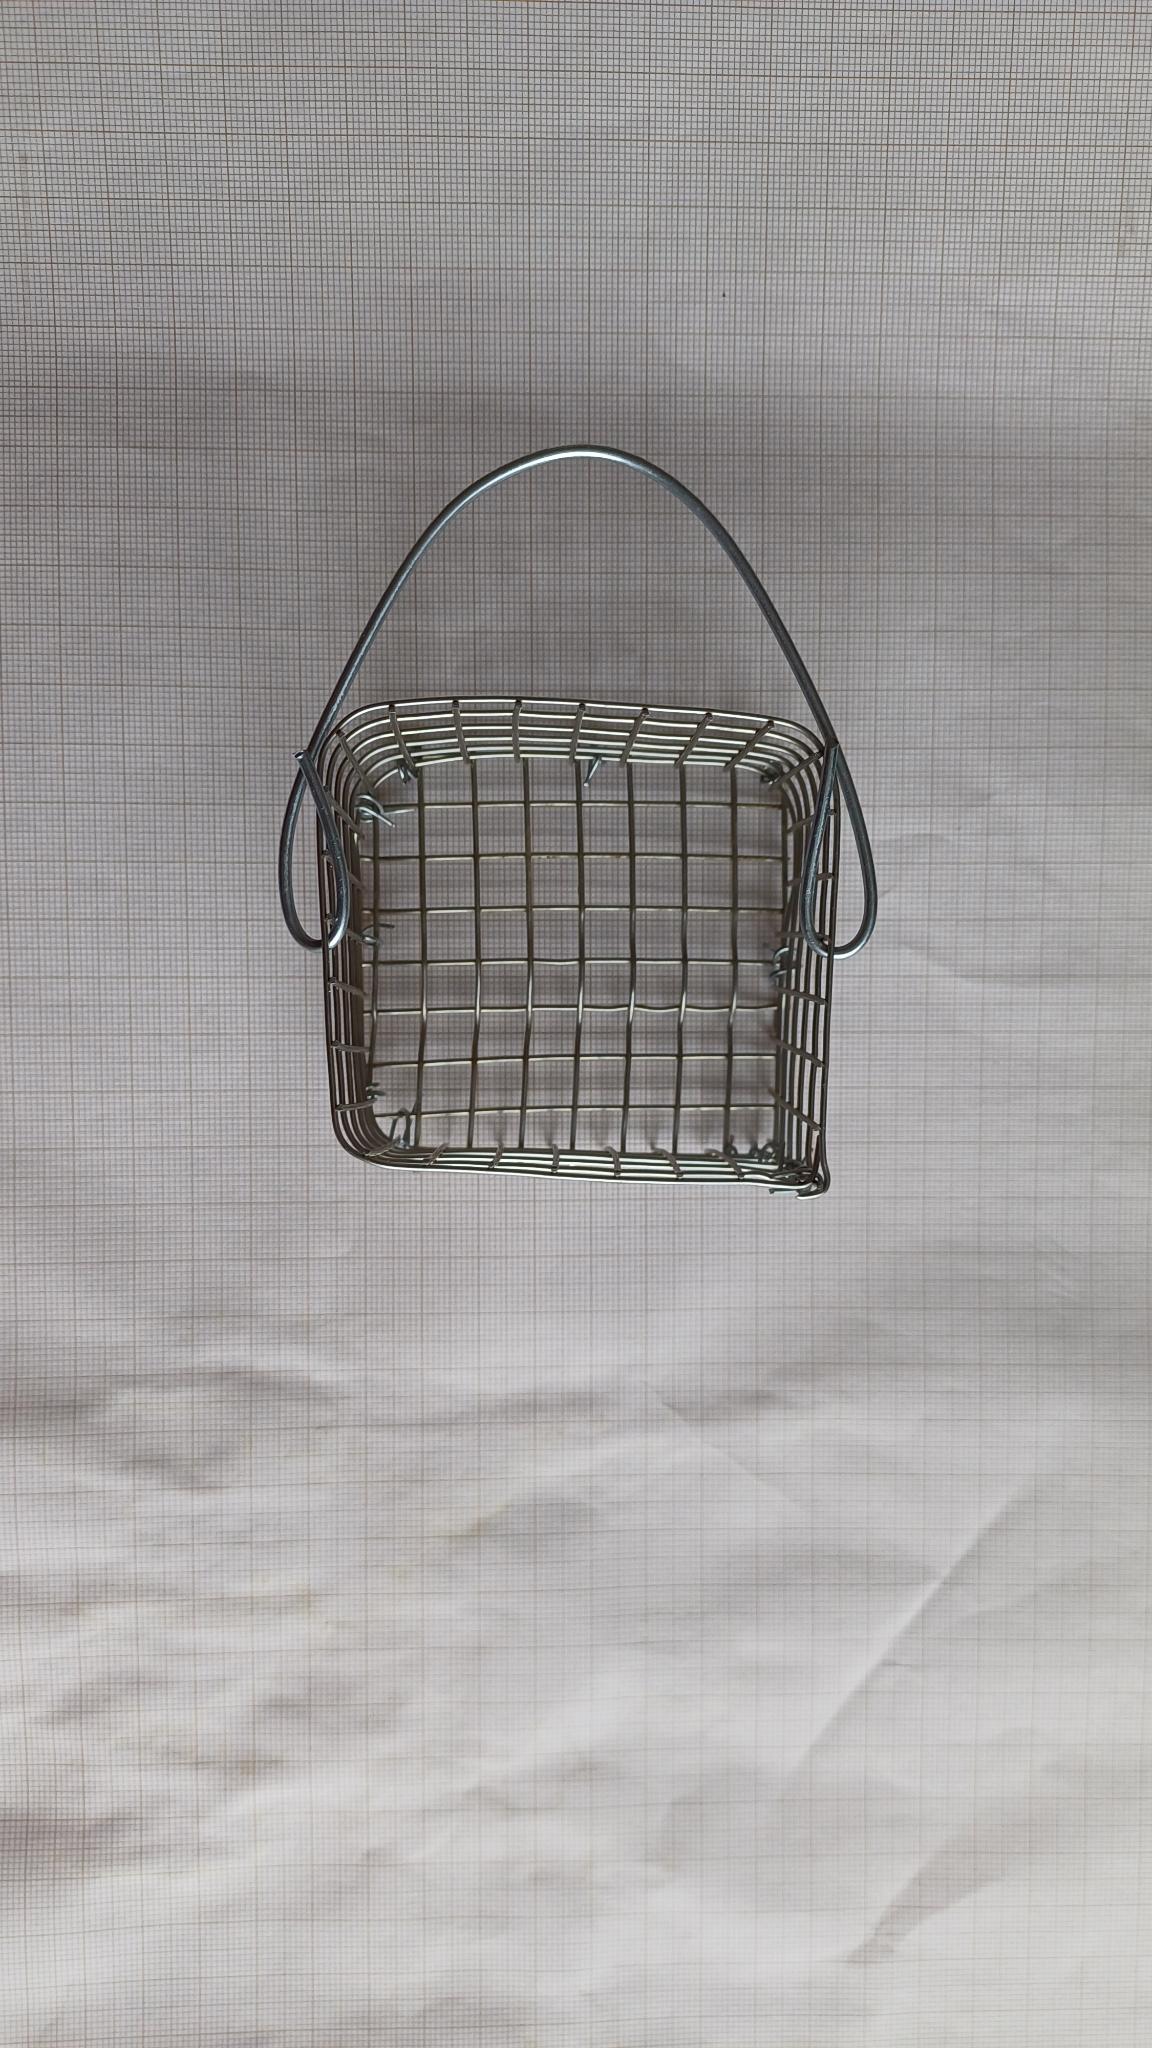
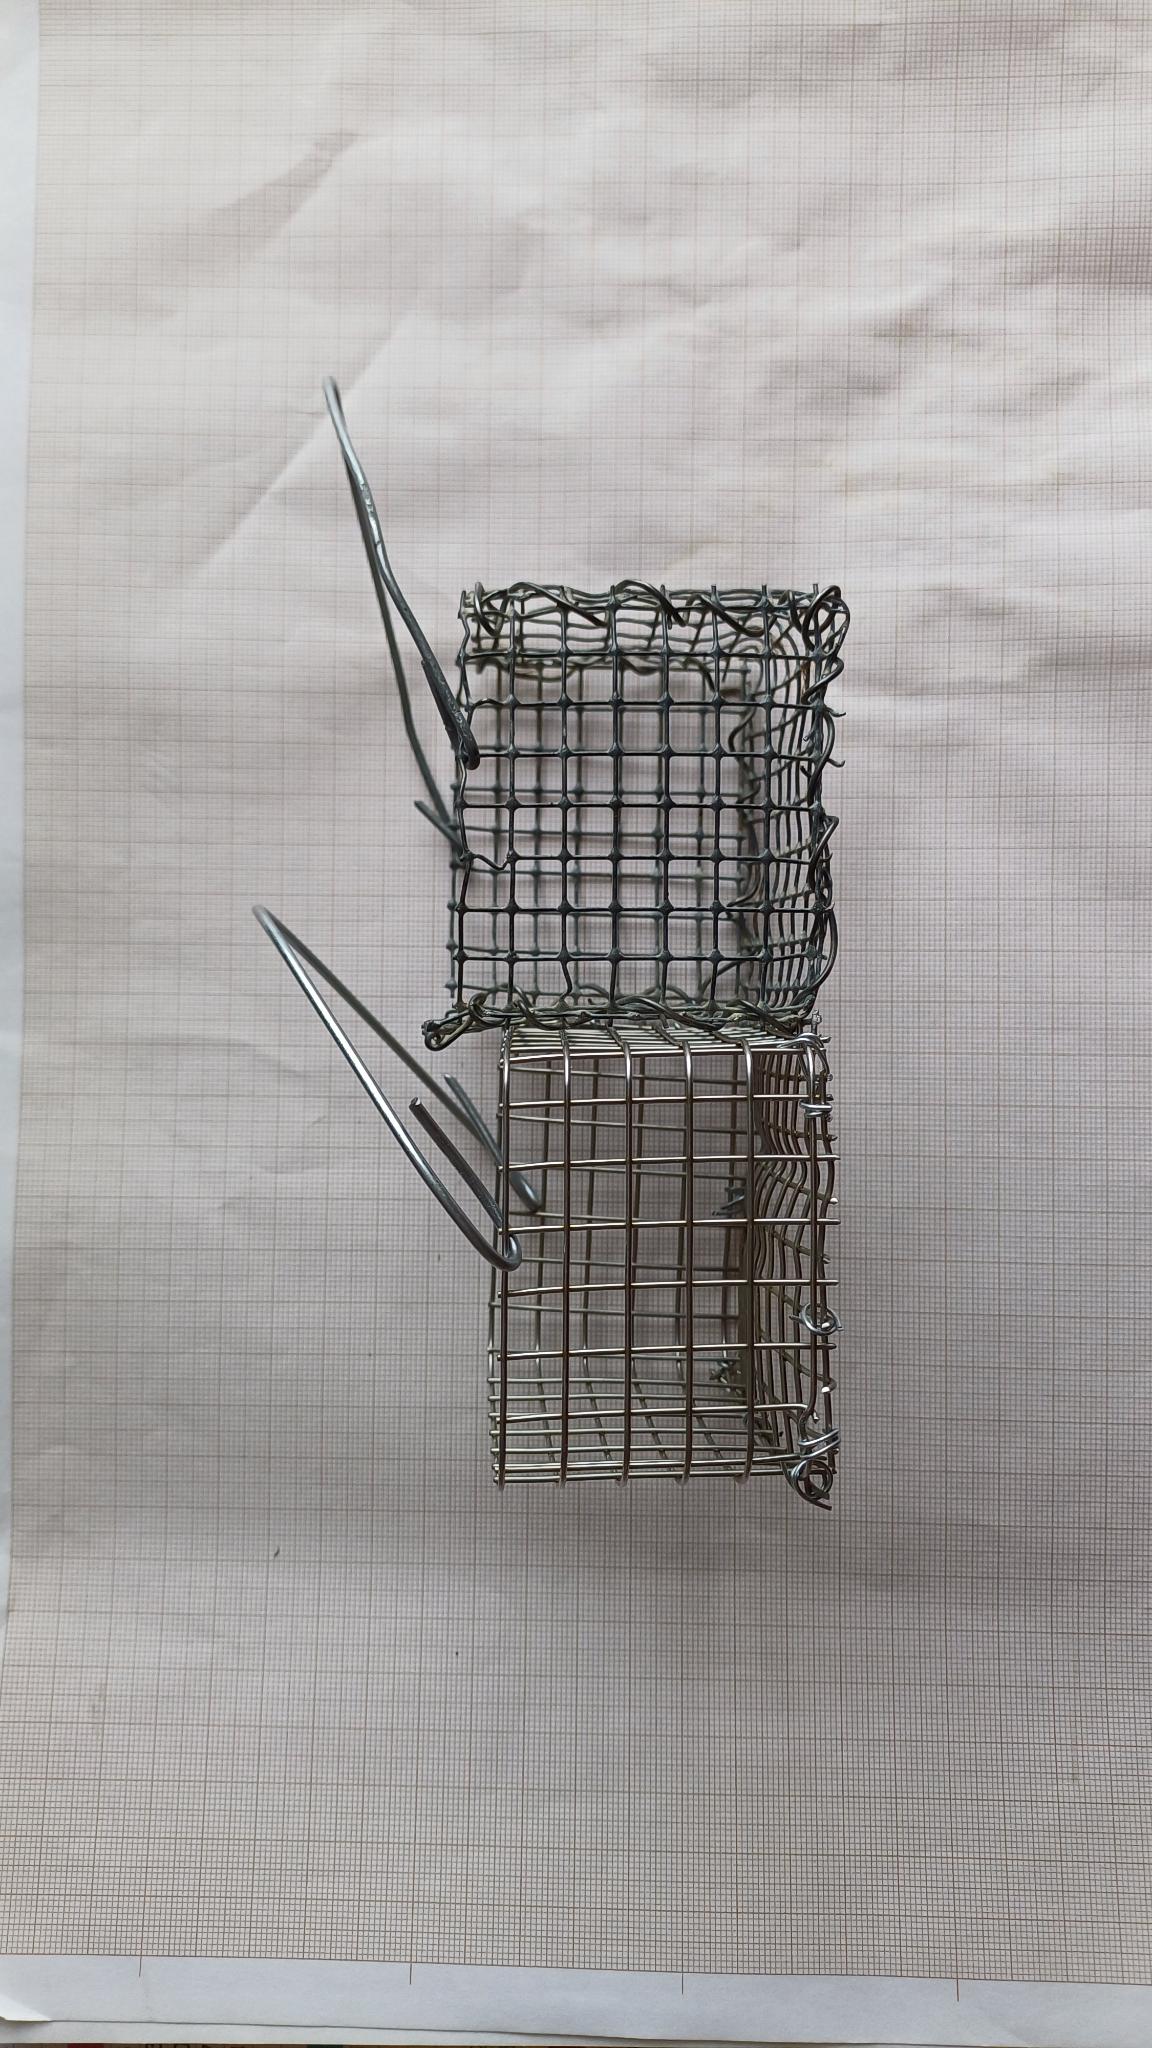
Figure 3: Panier (old : galvanisé, new : inox)
4.4.3. Photos (CRA-W / D3-U07 / Bât. Petermann)
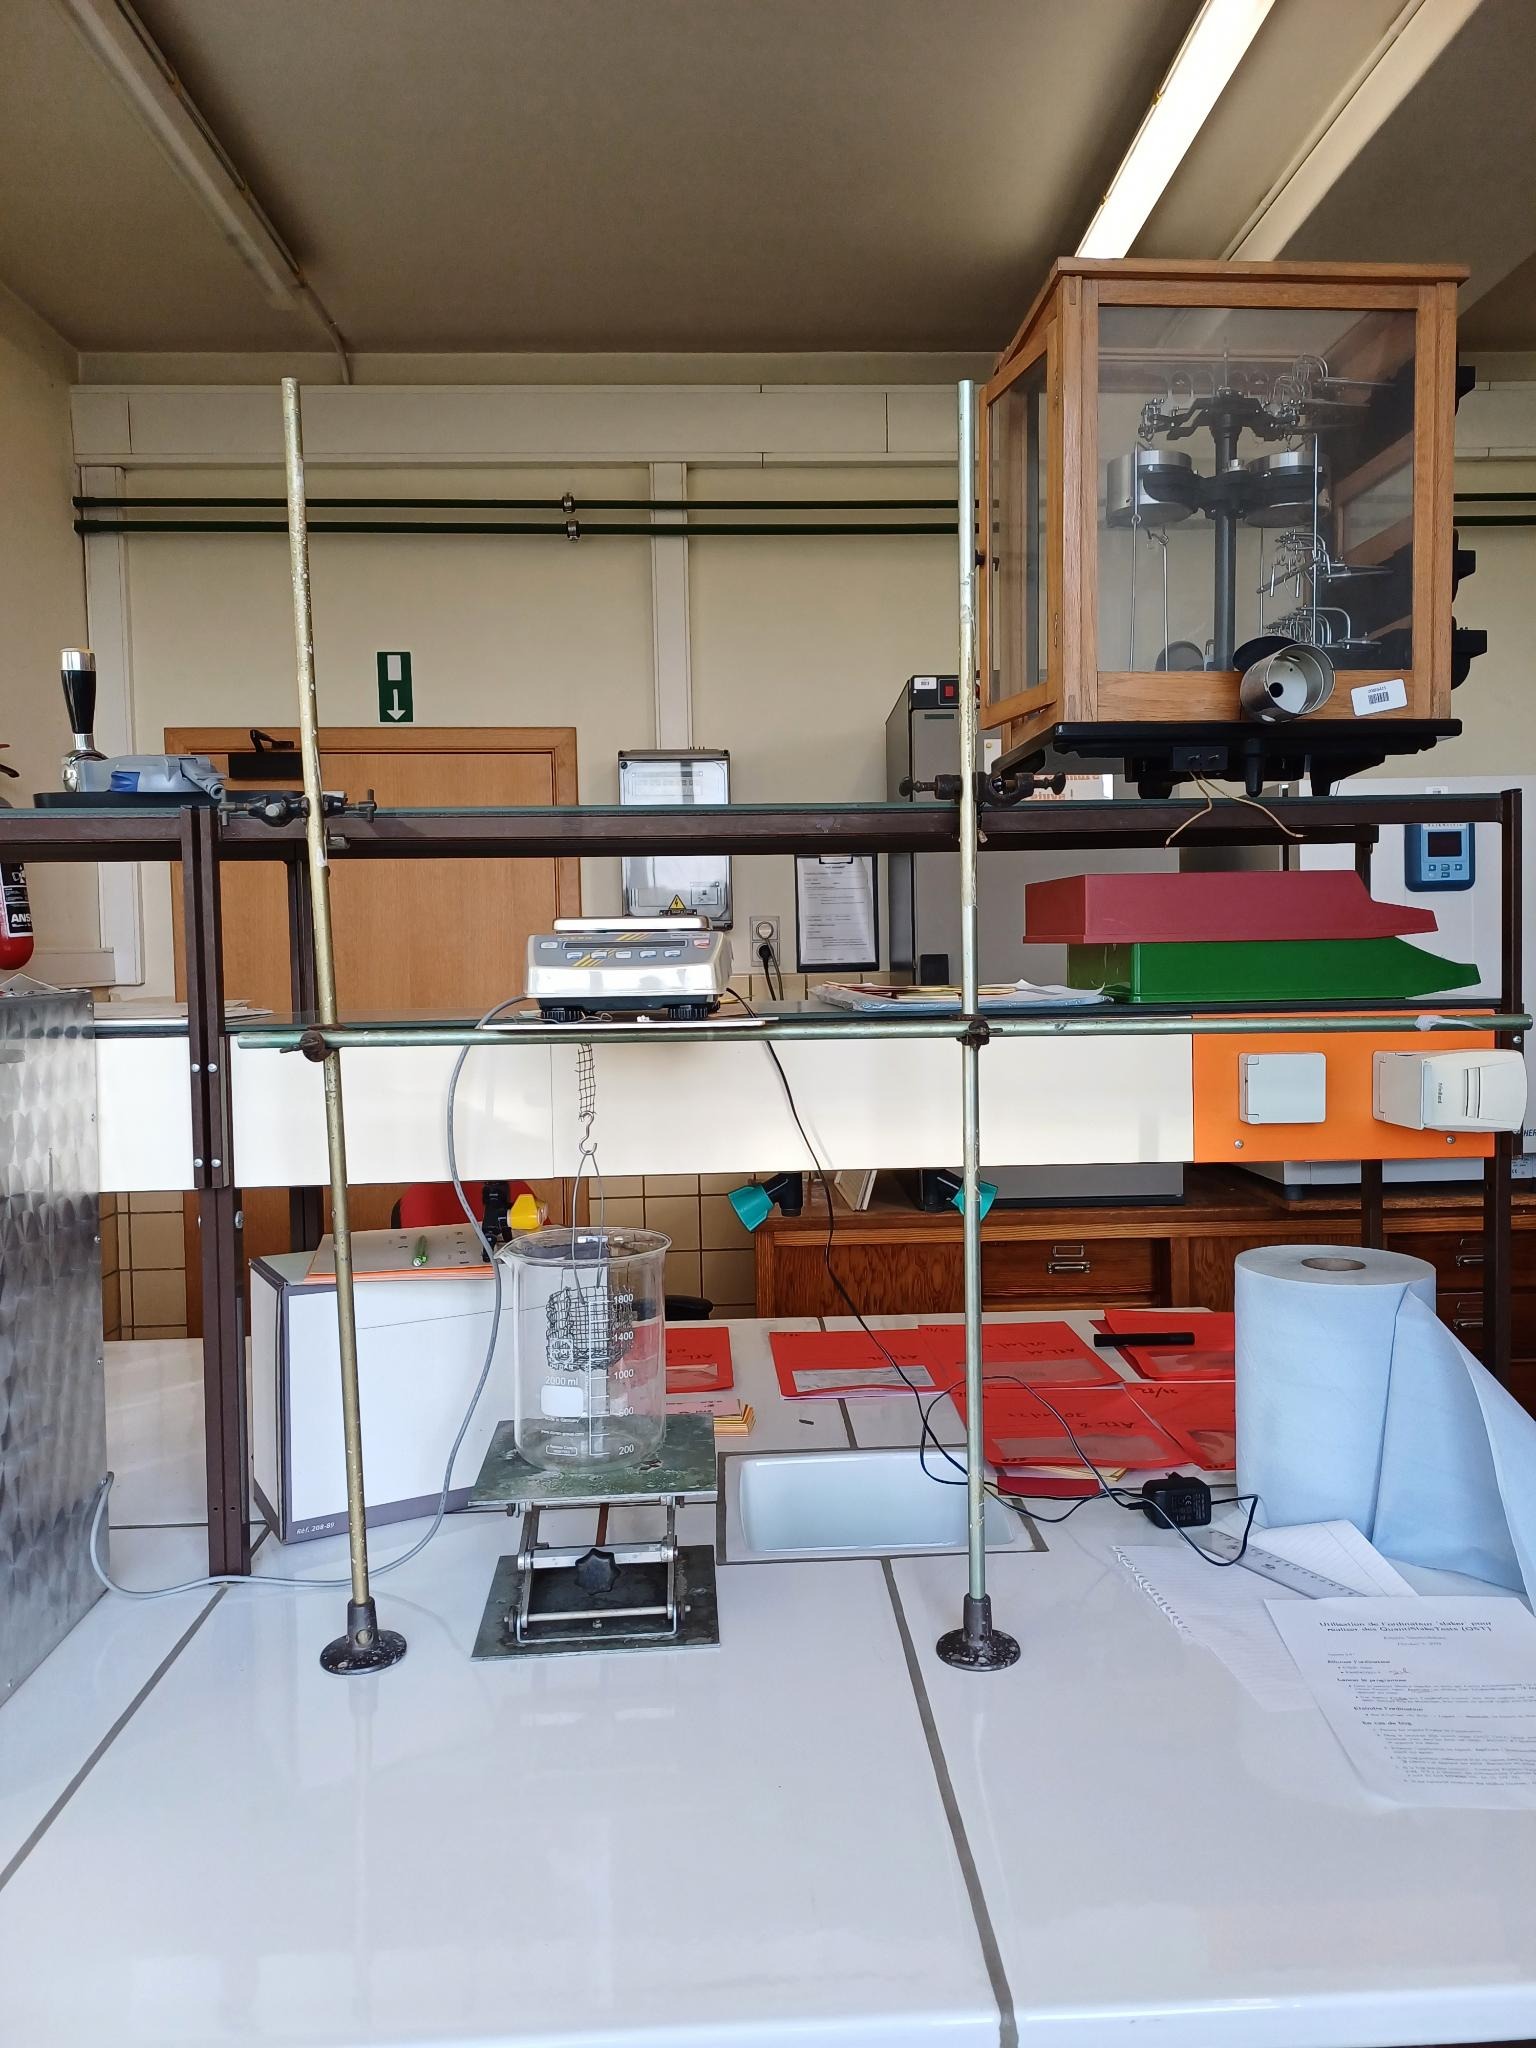
Figure 4: Simple equipment with lab stands
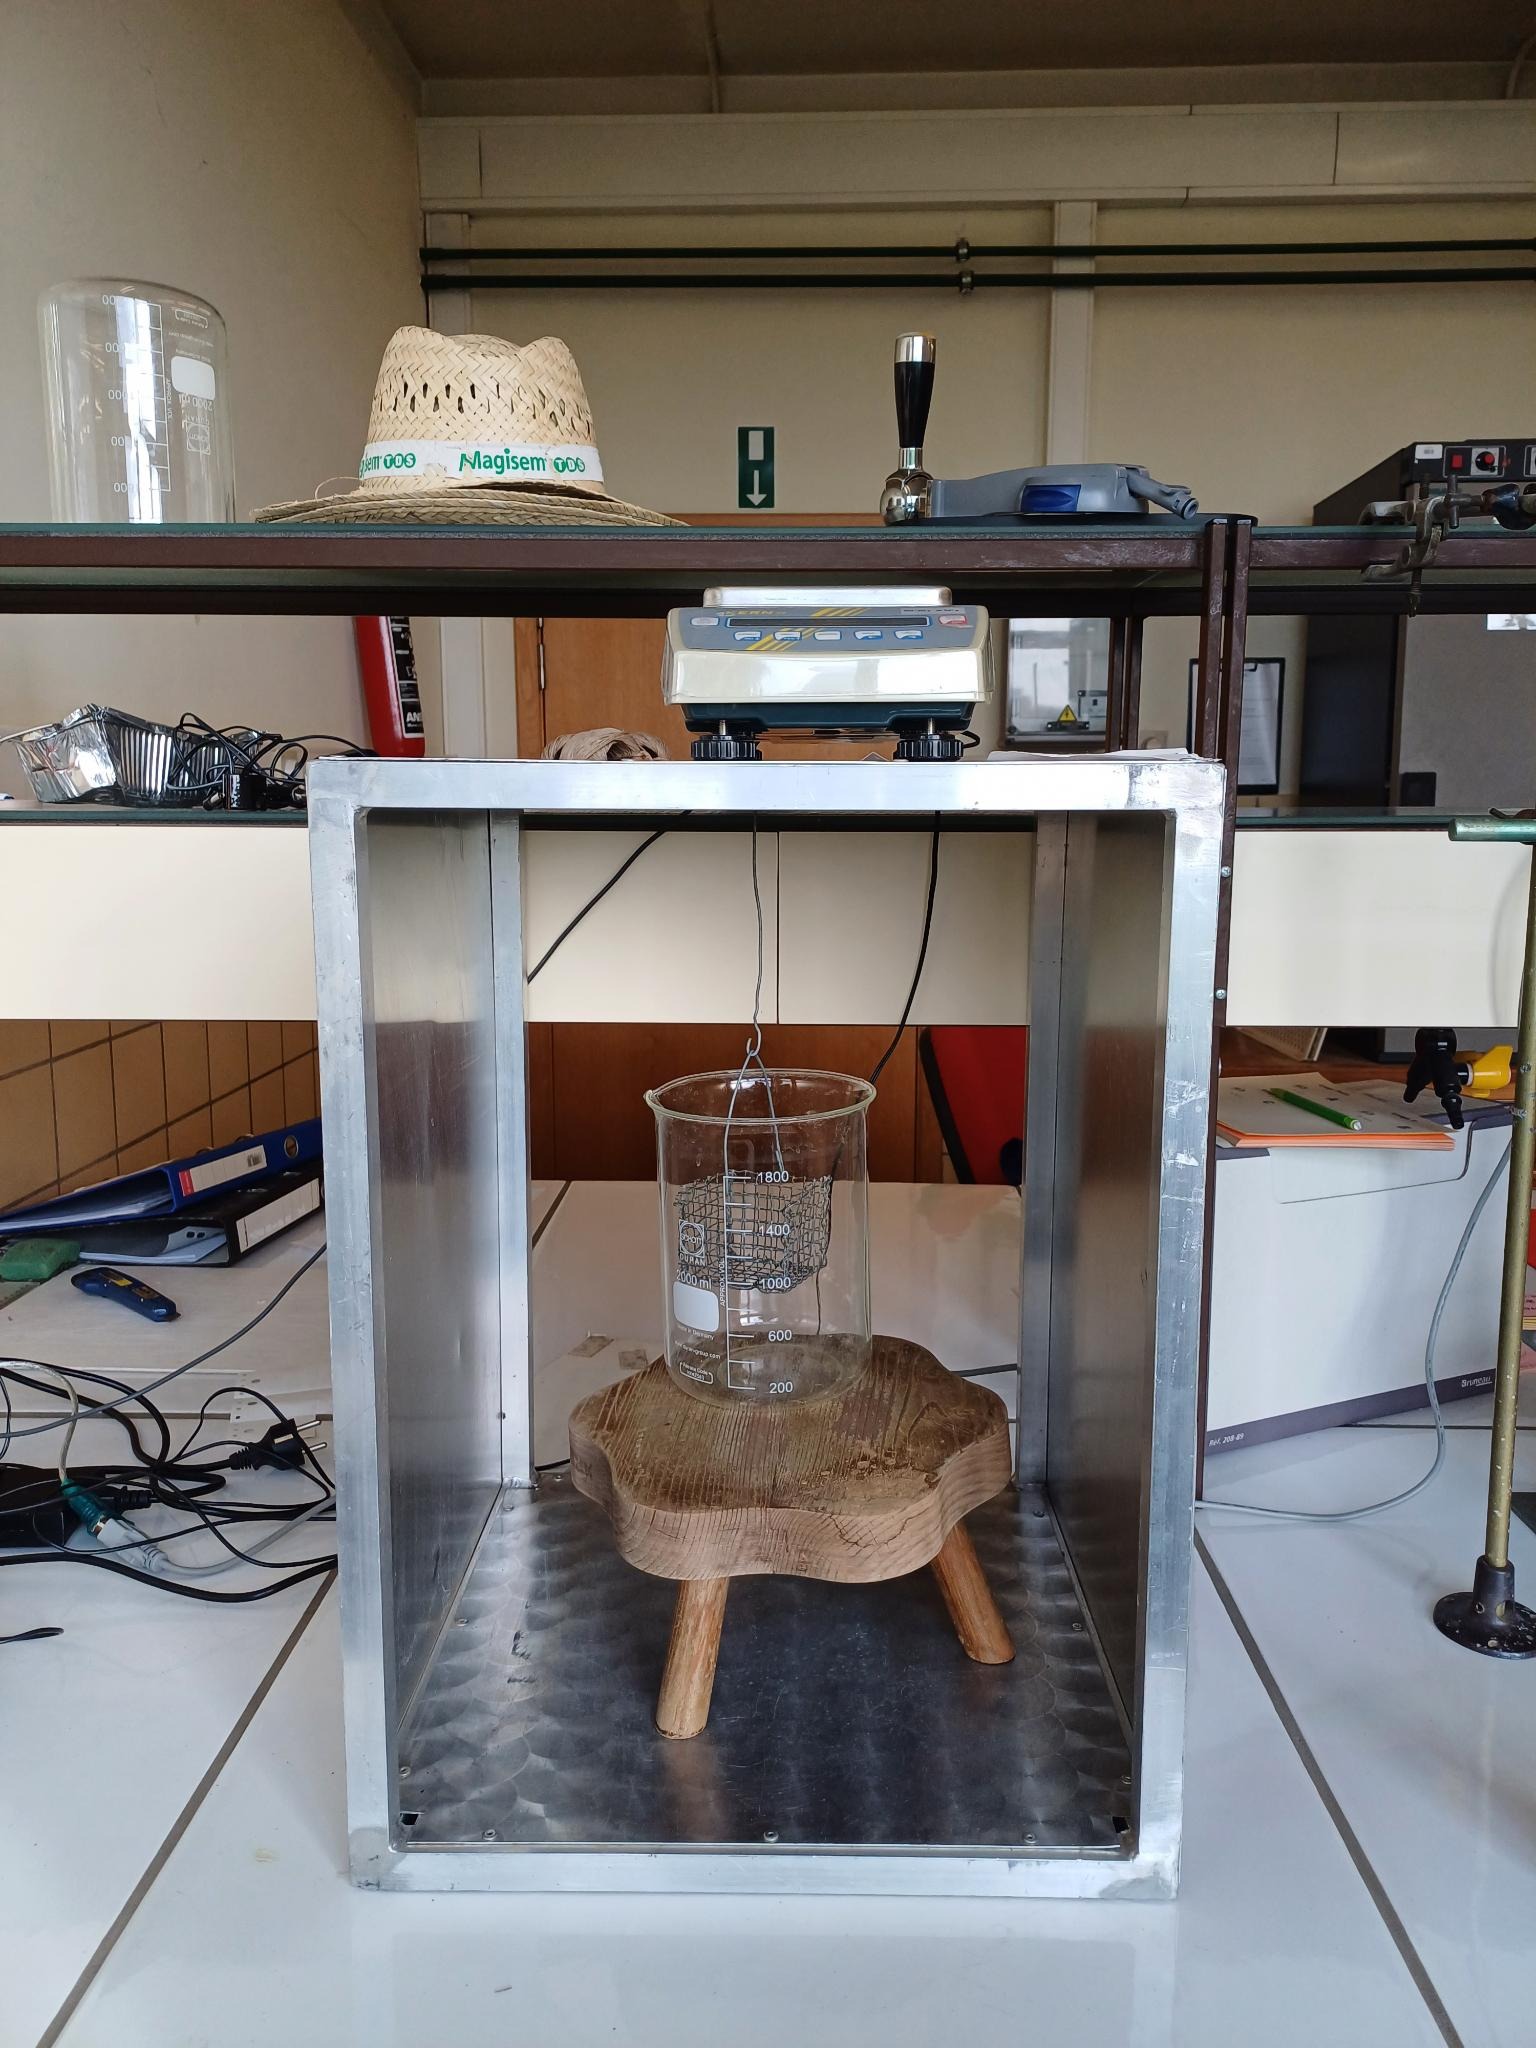
Figure 5: Welded aluminium equipment
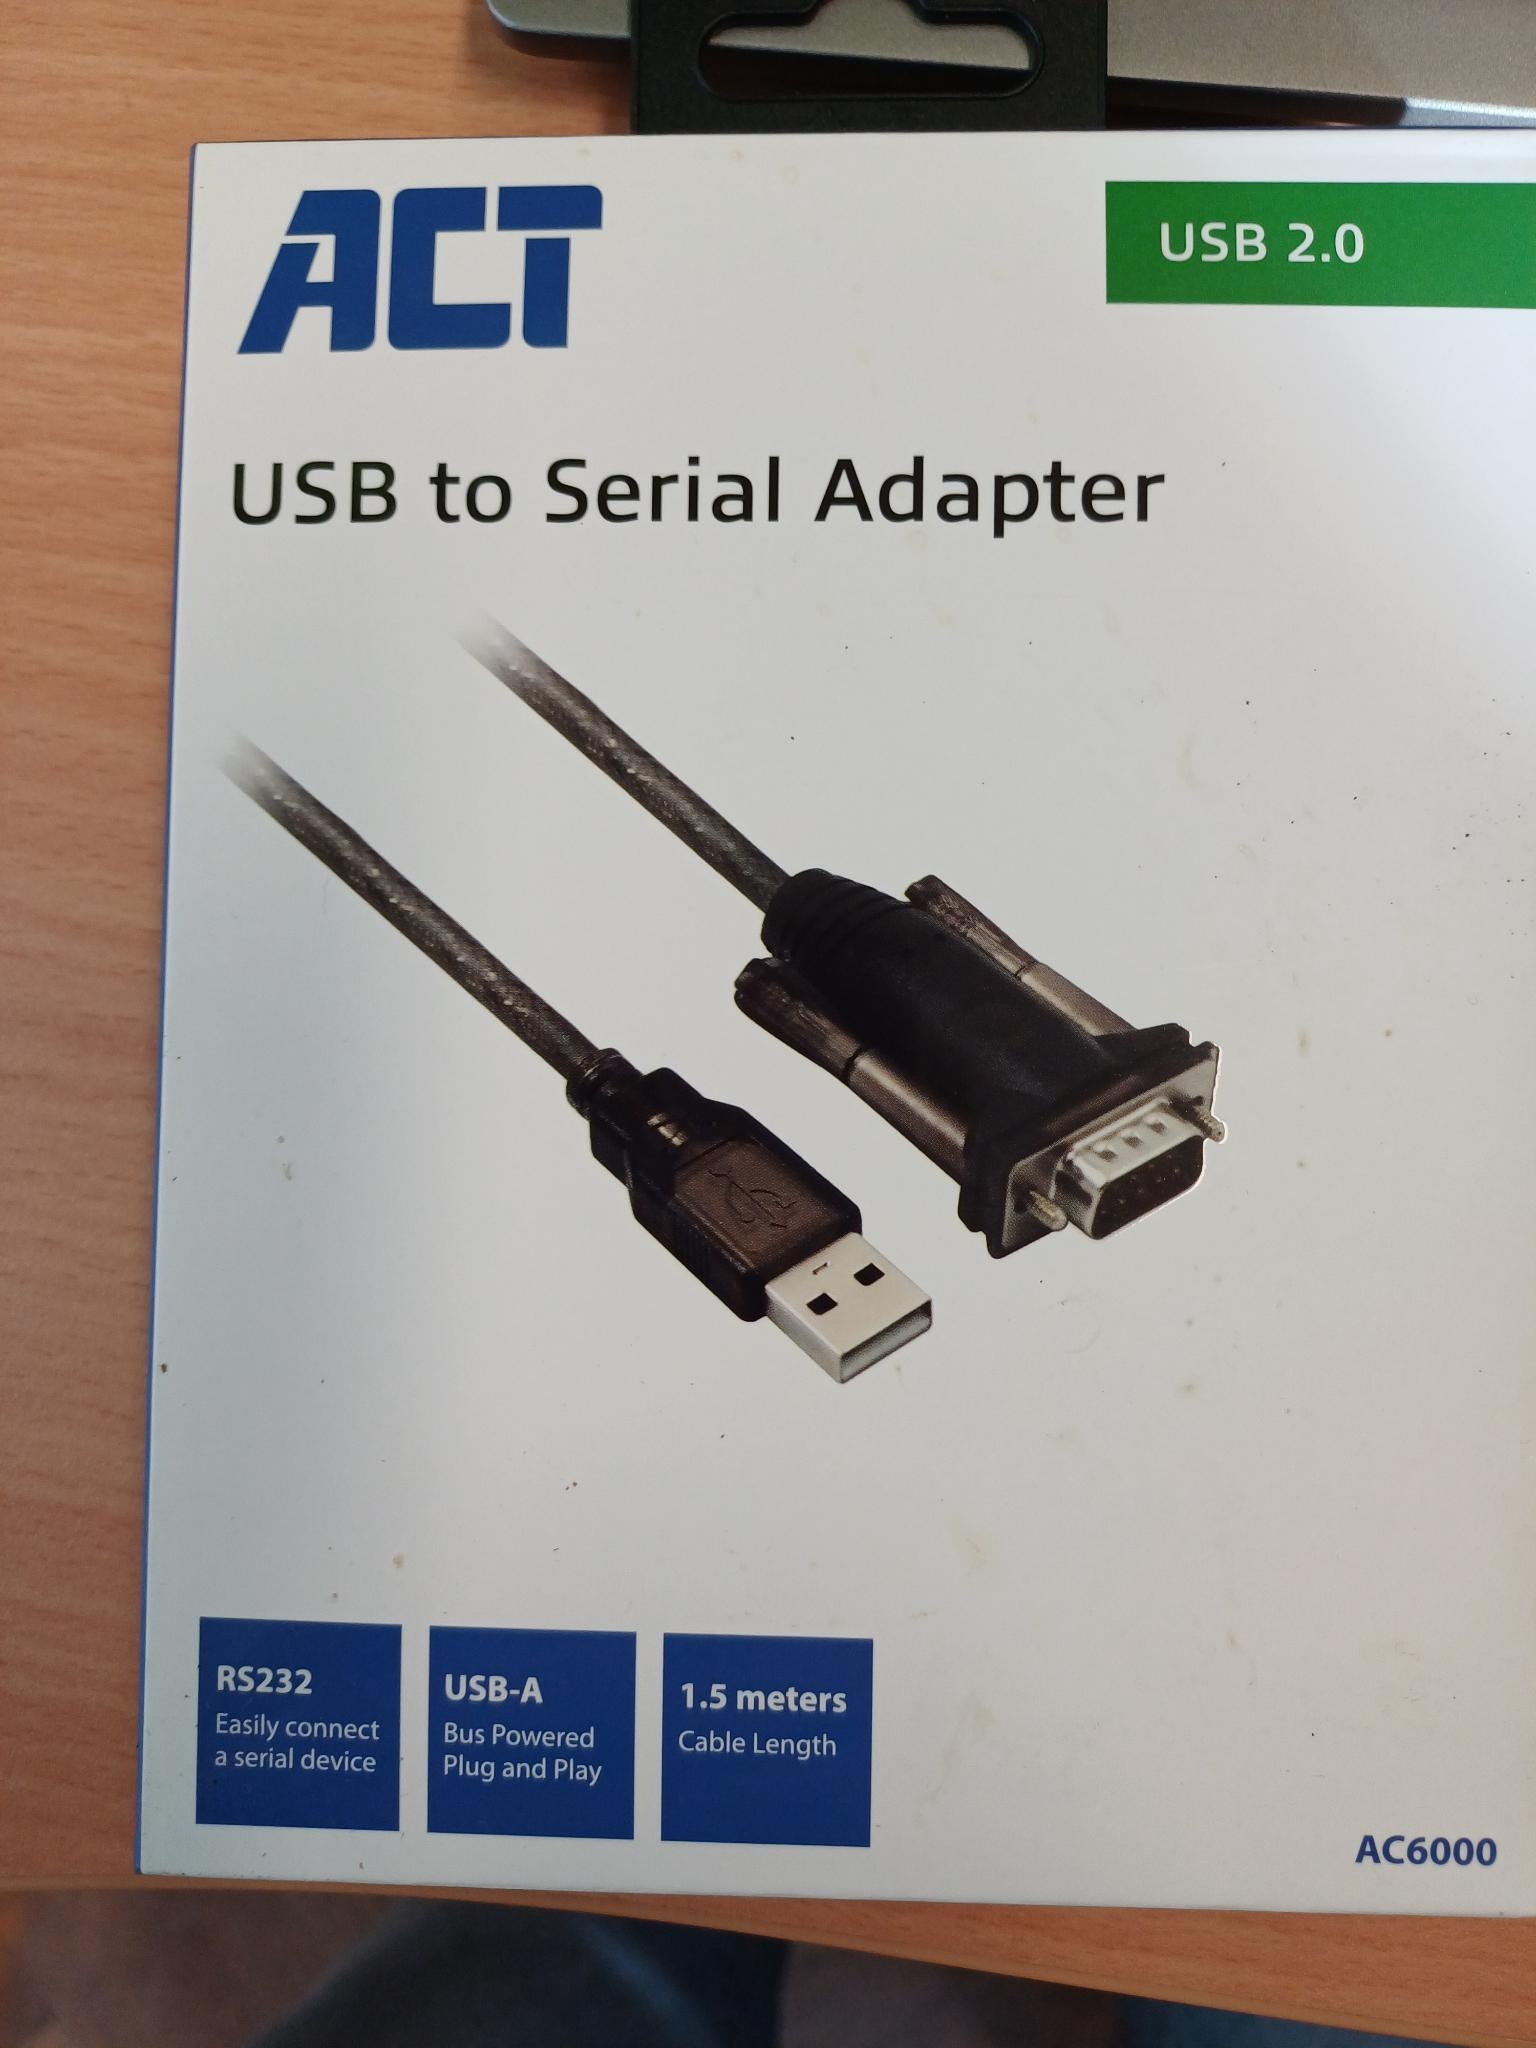
Figure 6: Connection wire between each scale and computer
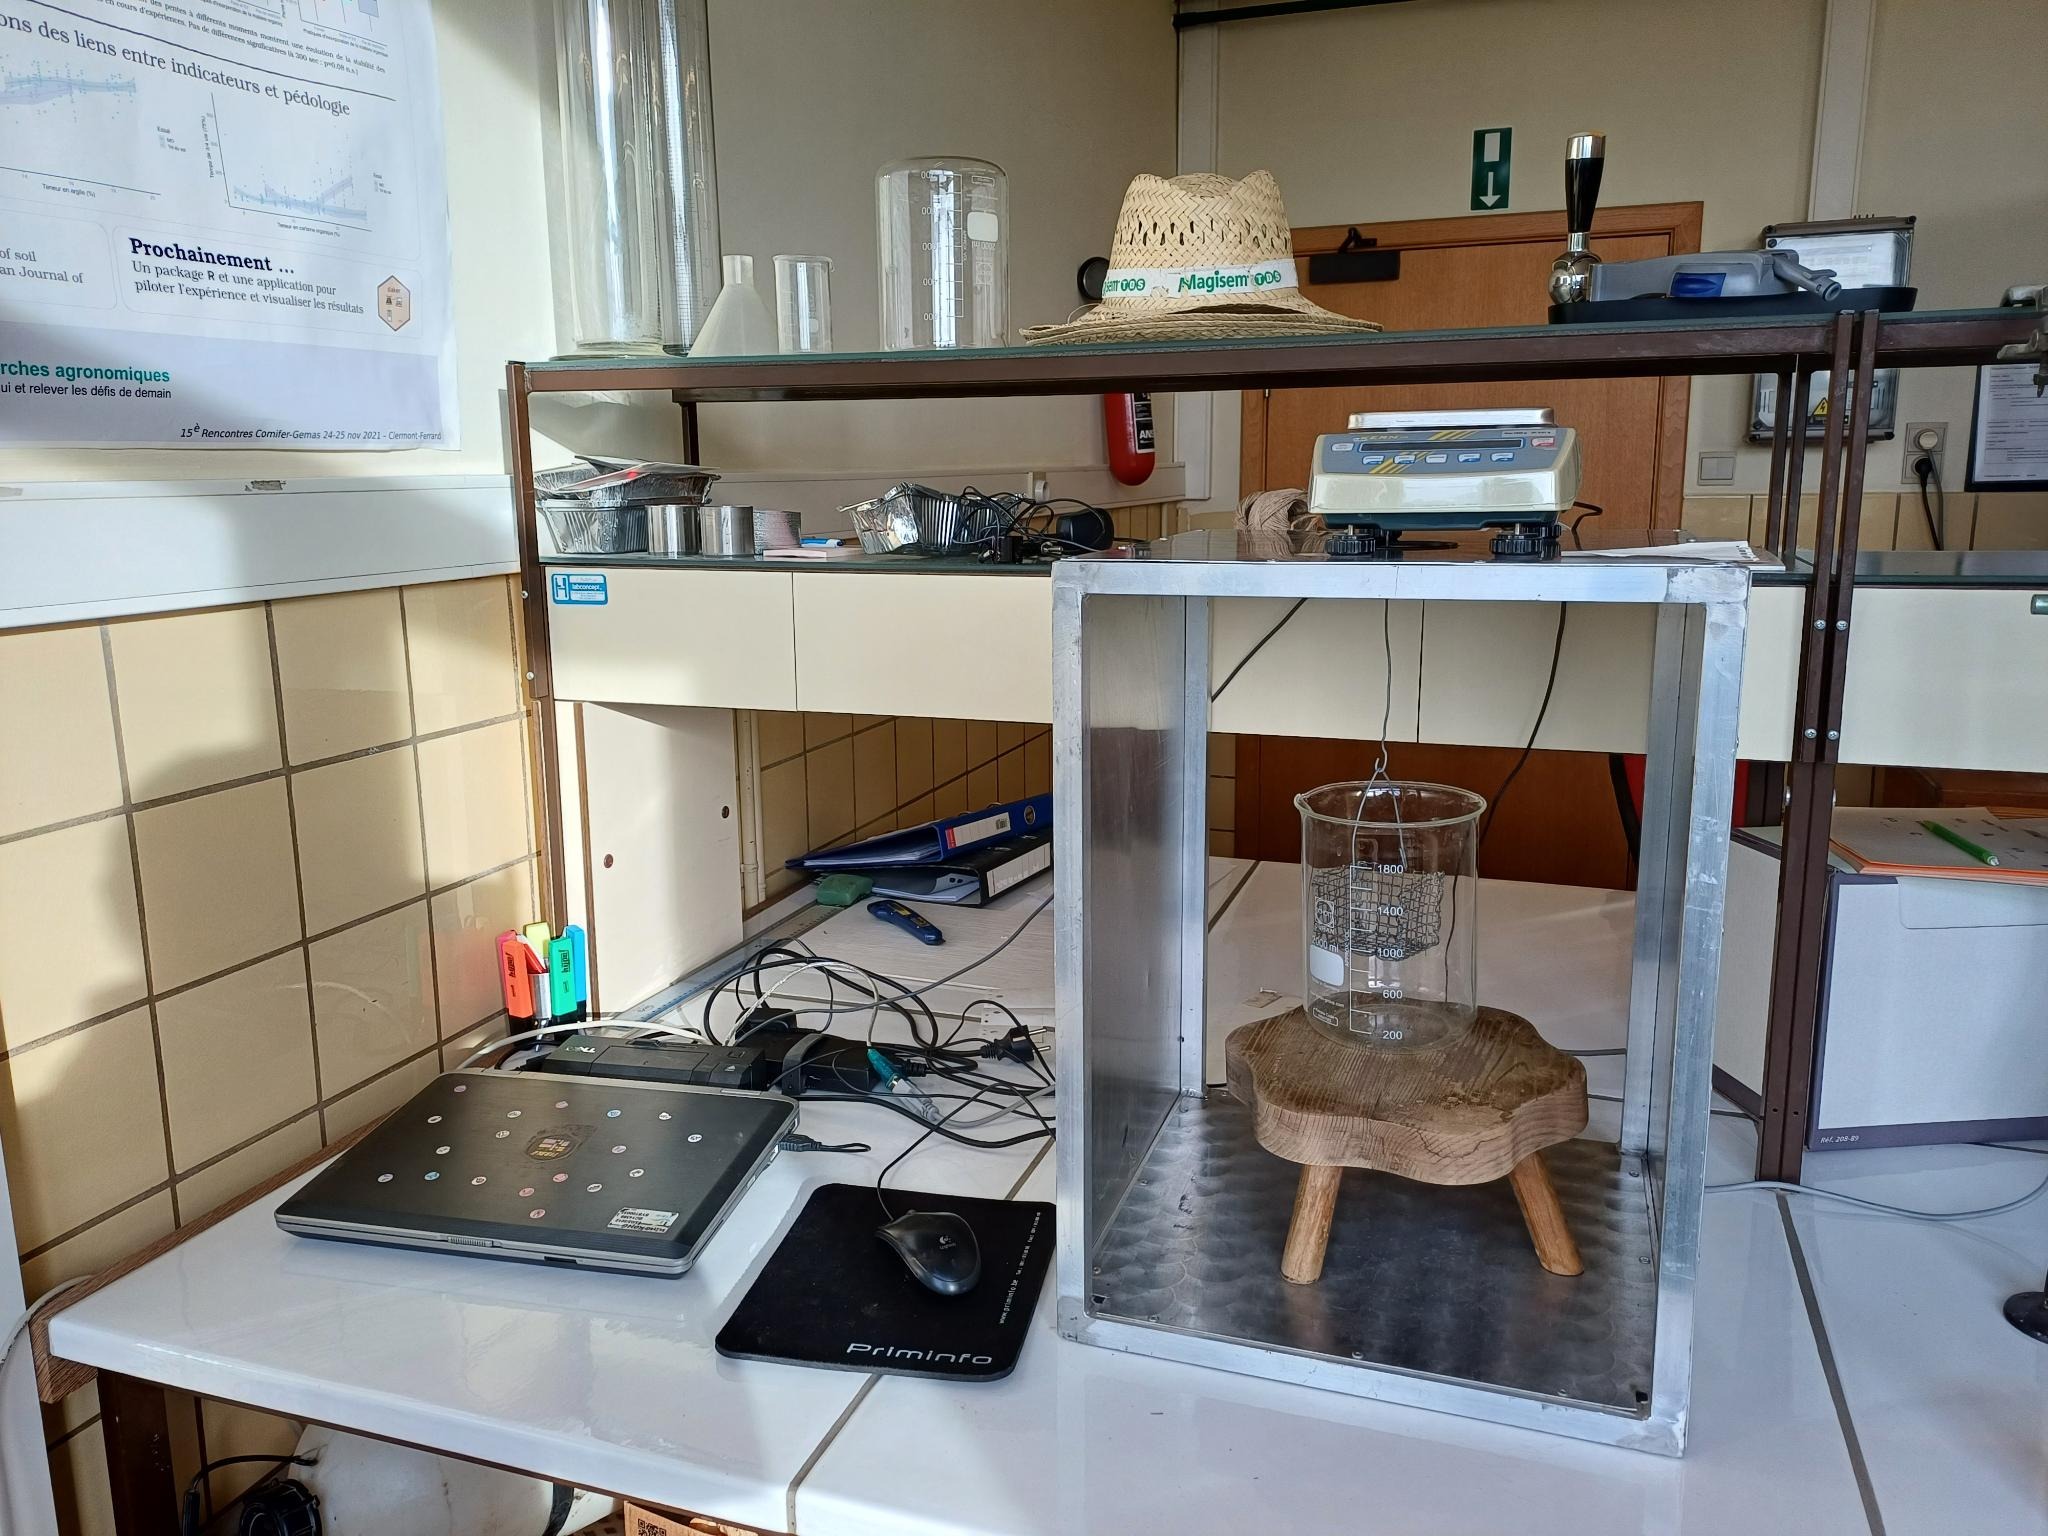
Figure 7: Computer connections
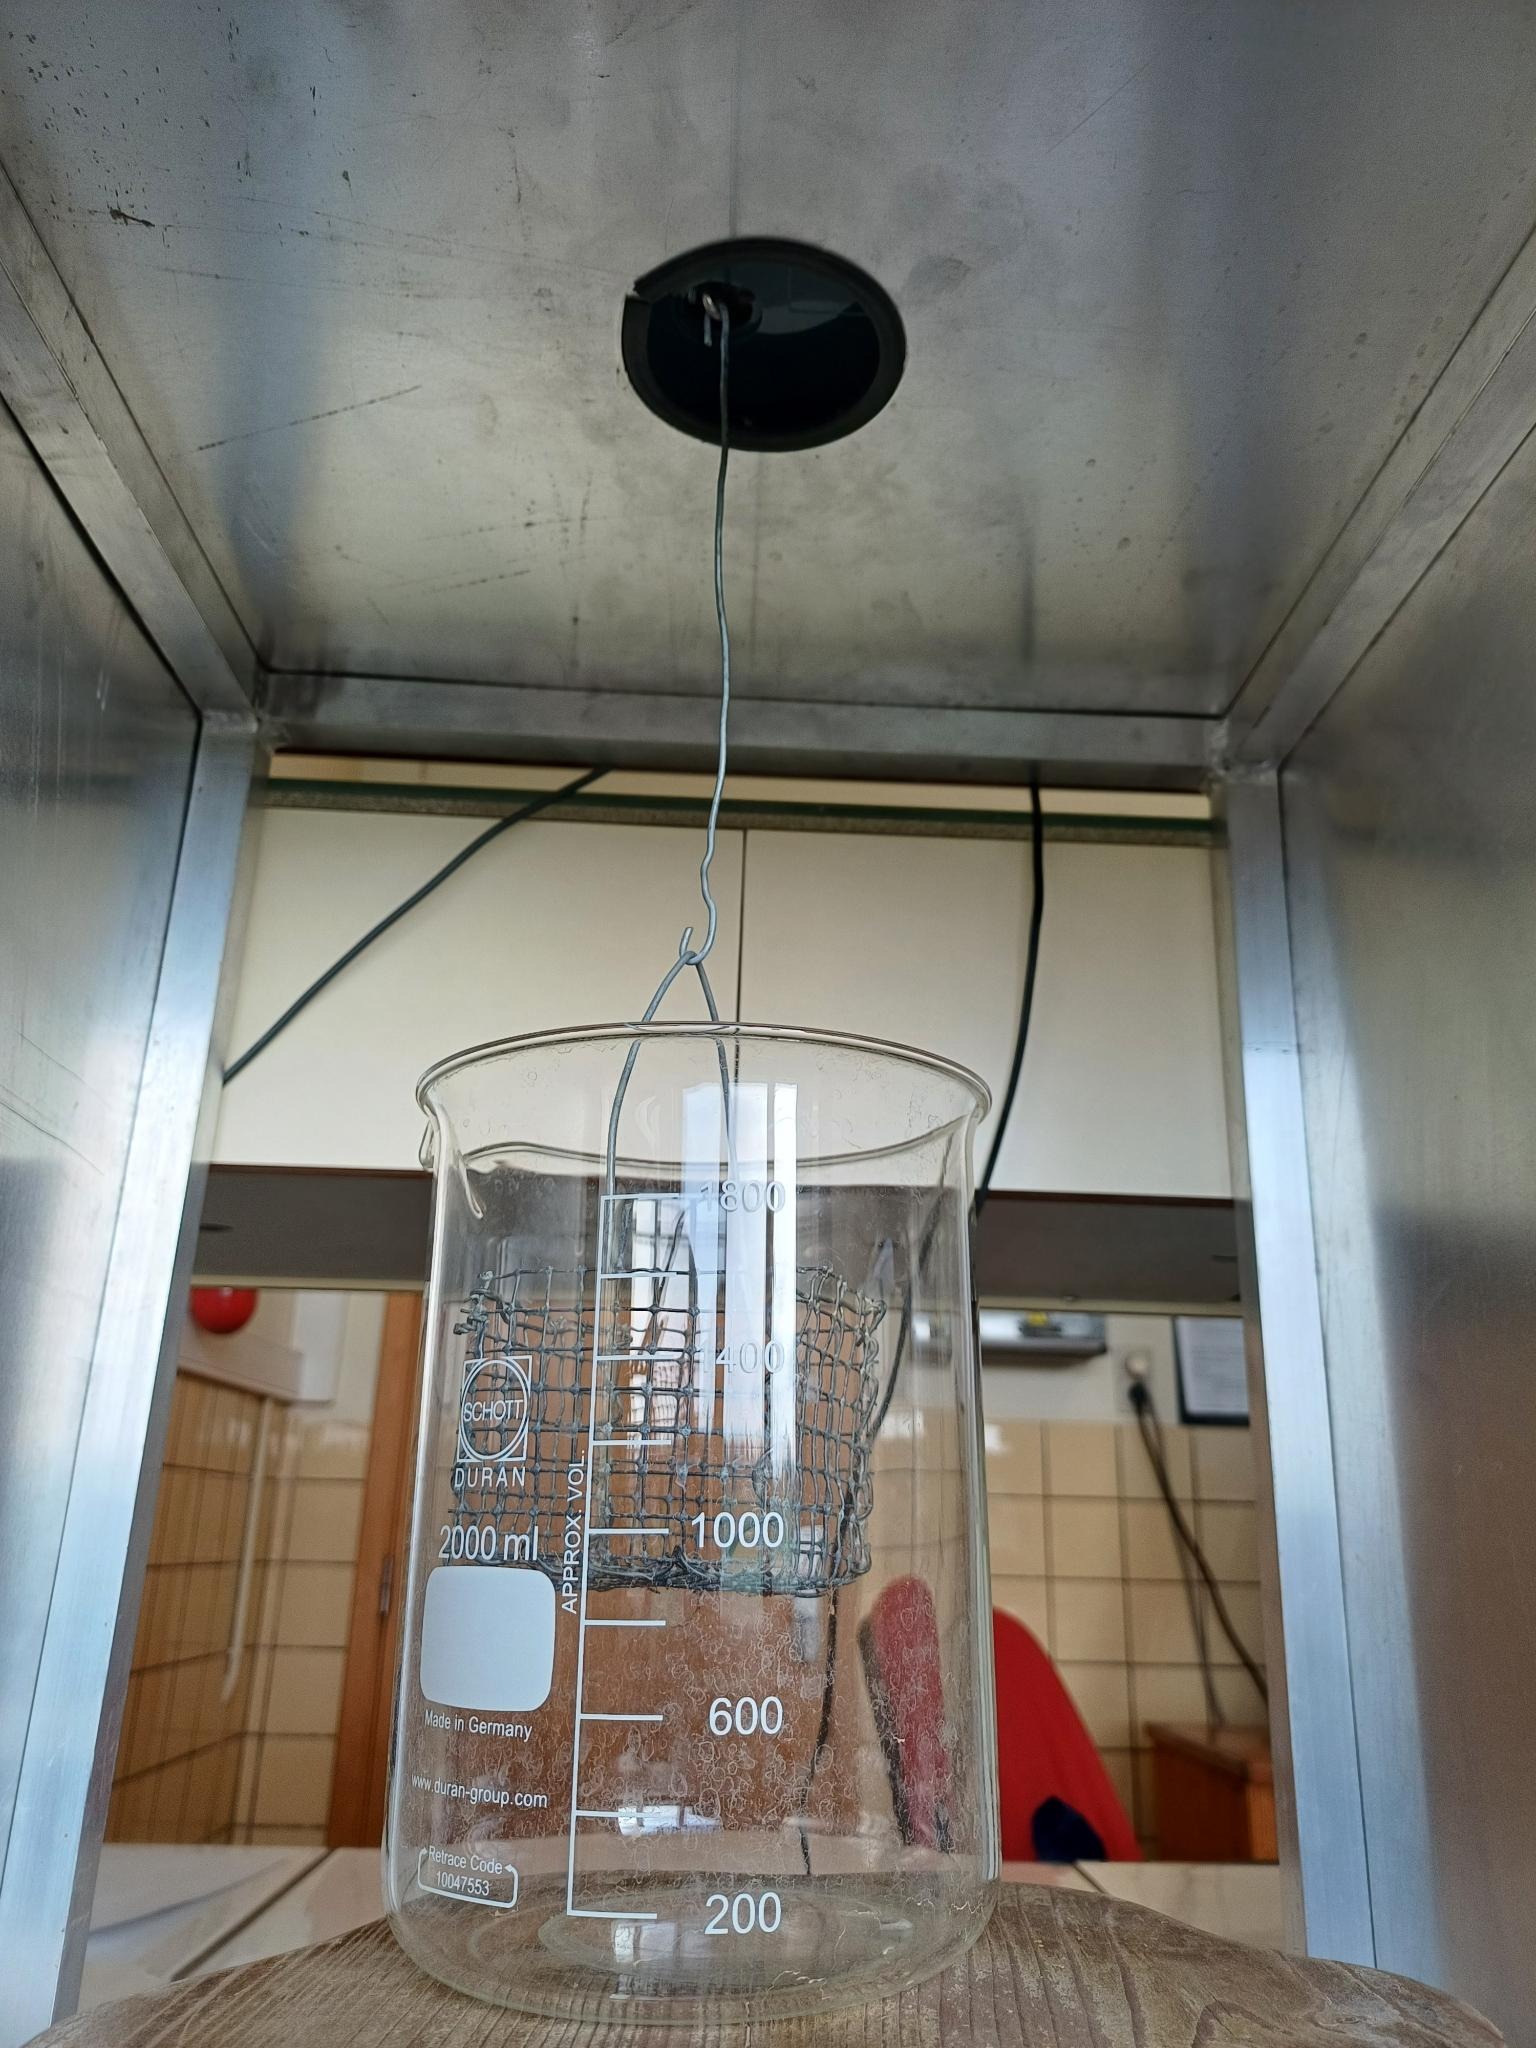
Figure 8: Hook for suspended weighing 2
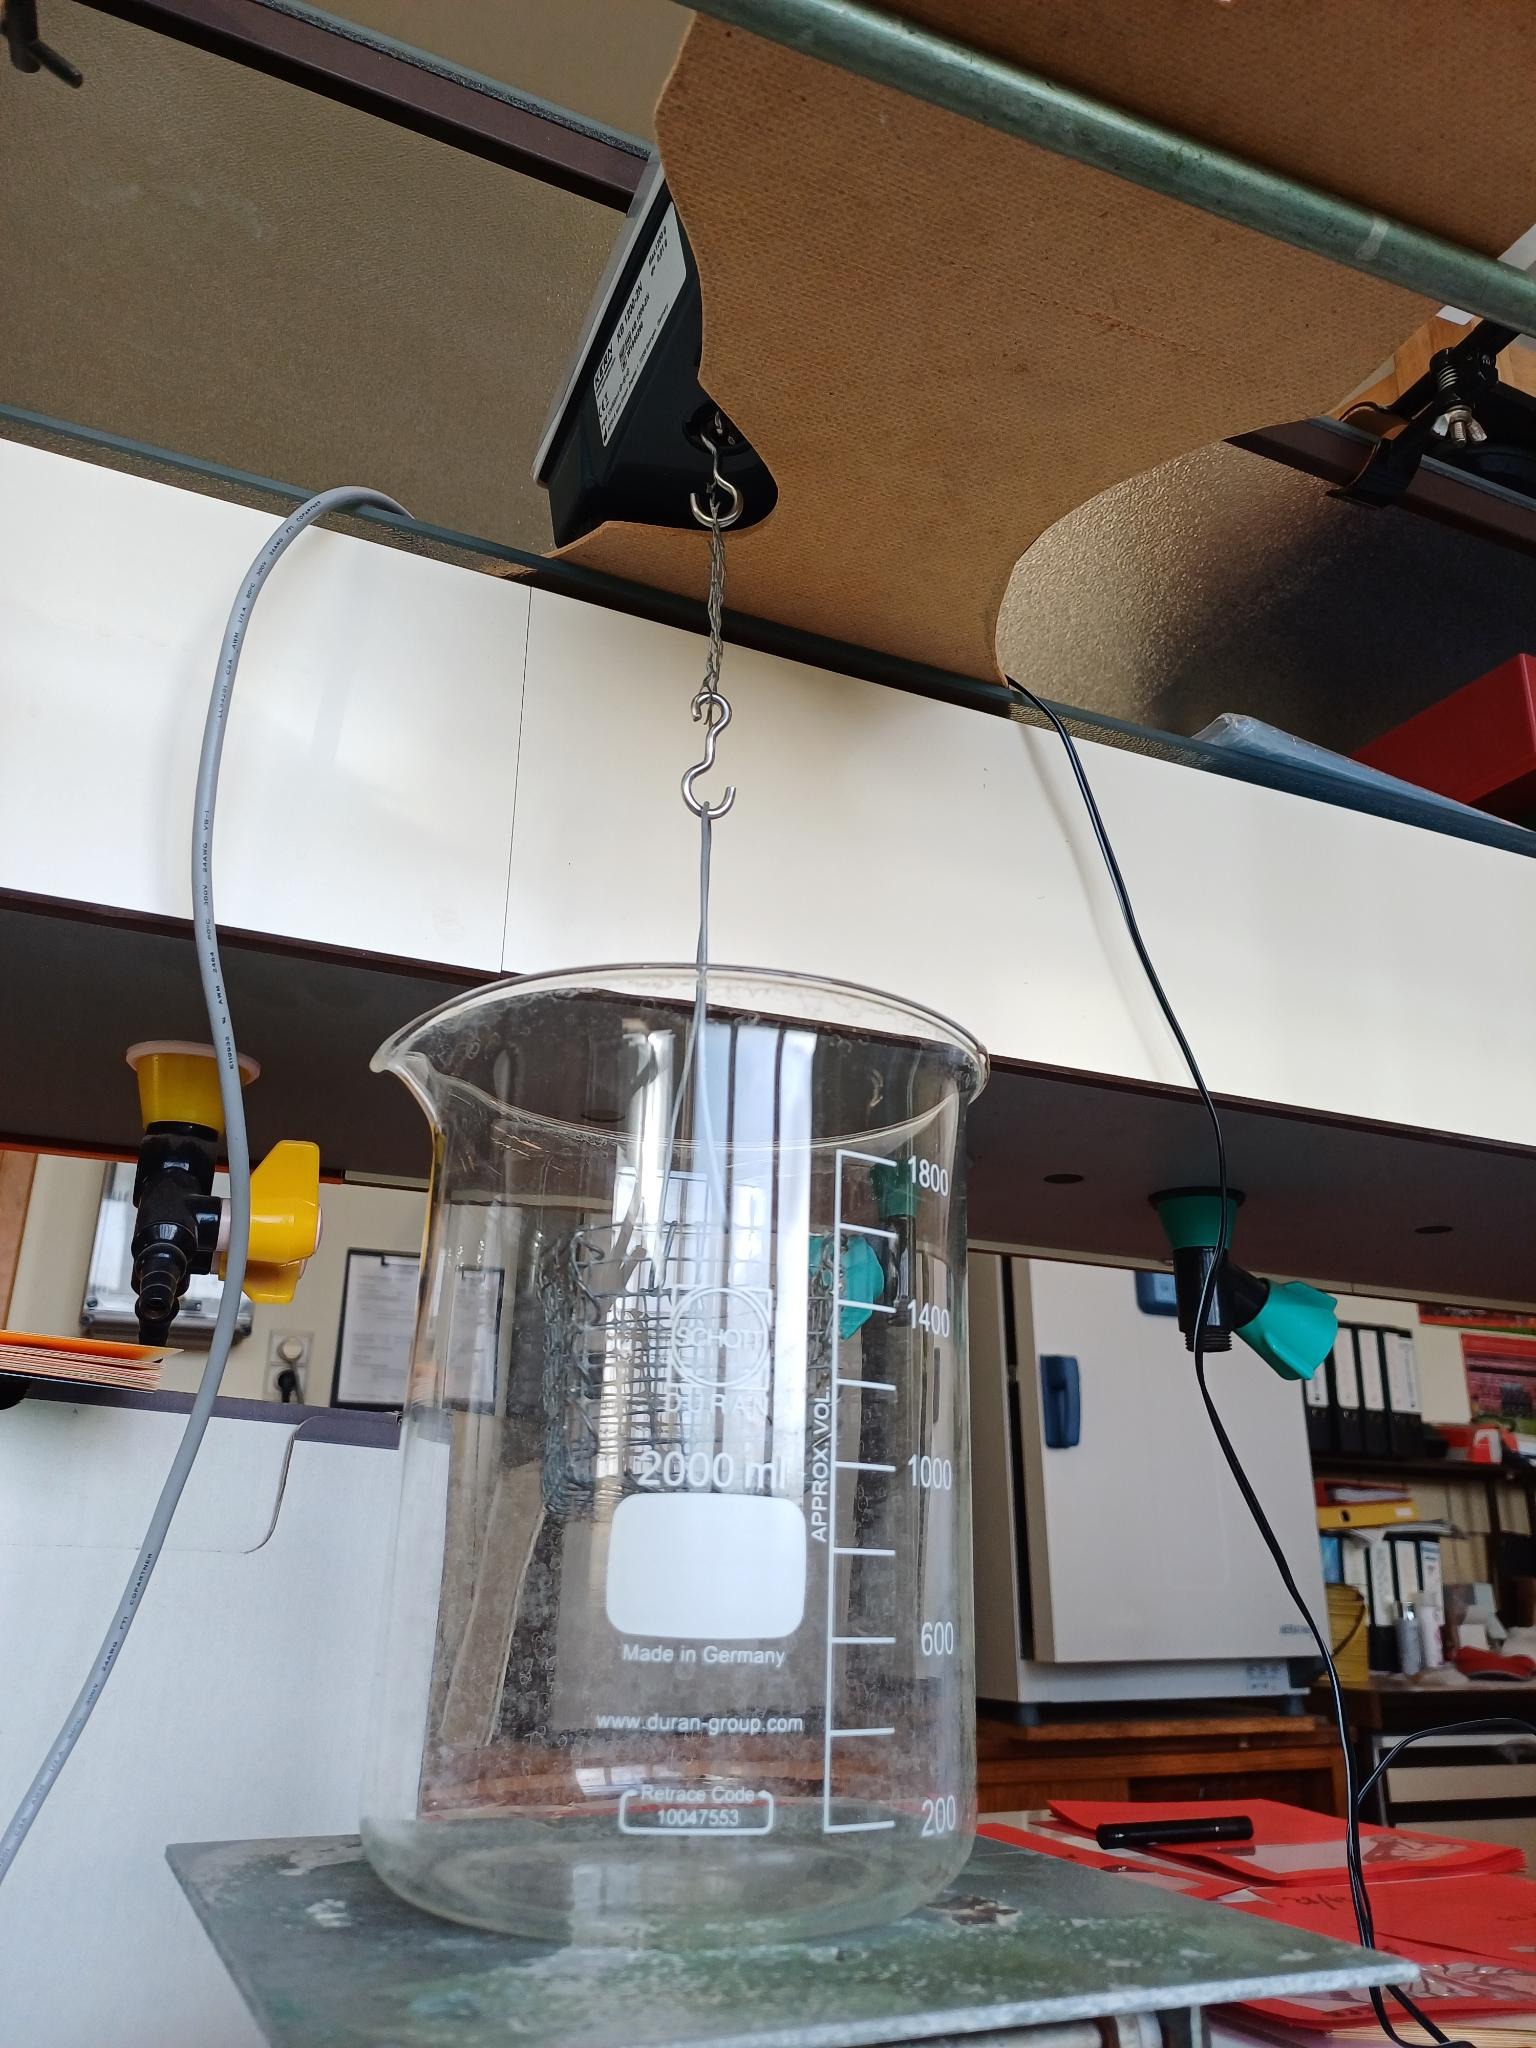
Figure 9: Hook for suspended weighing 1
4.4.3.1. New Scale
4.4.3.2. Zoom Paniers
4.4.3.2.1. old
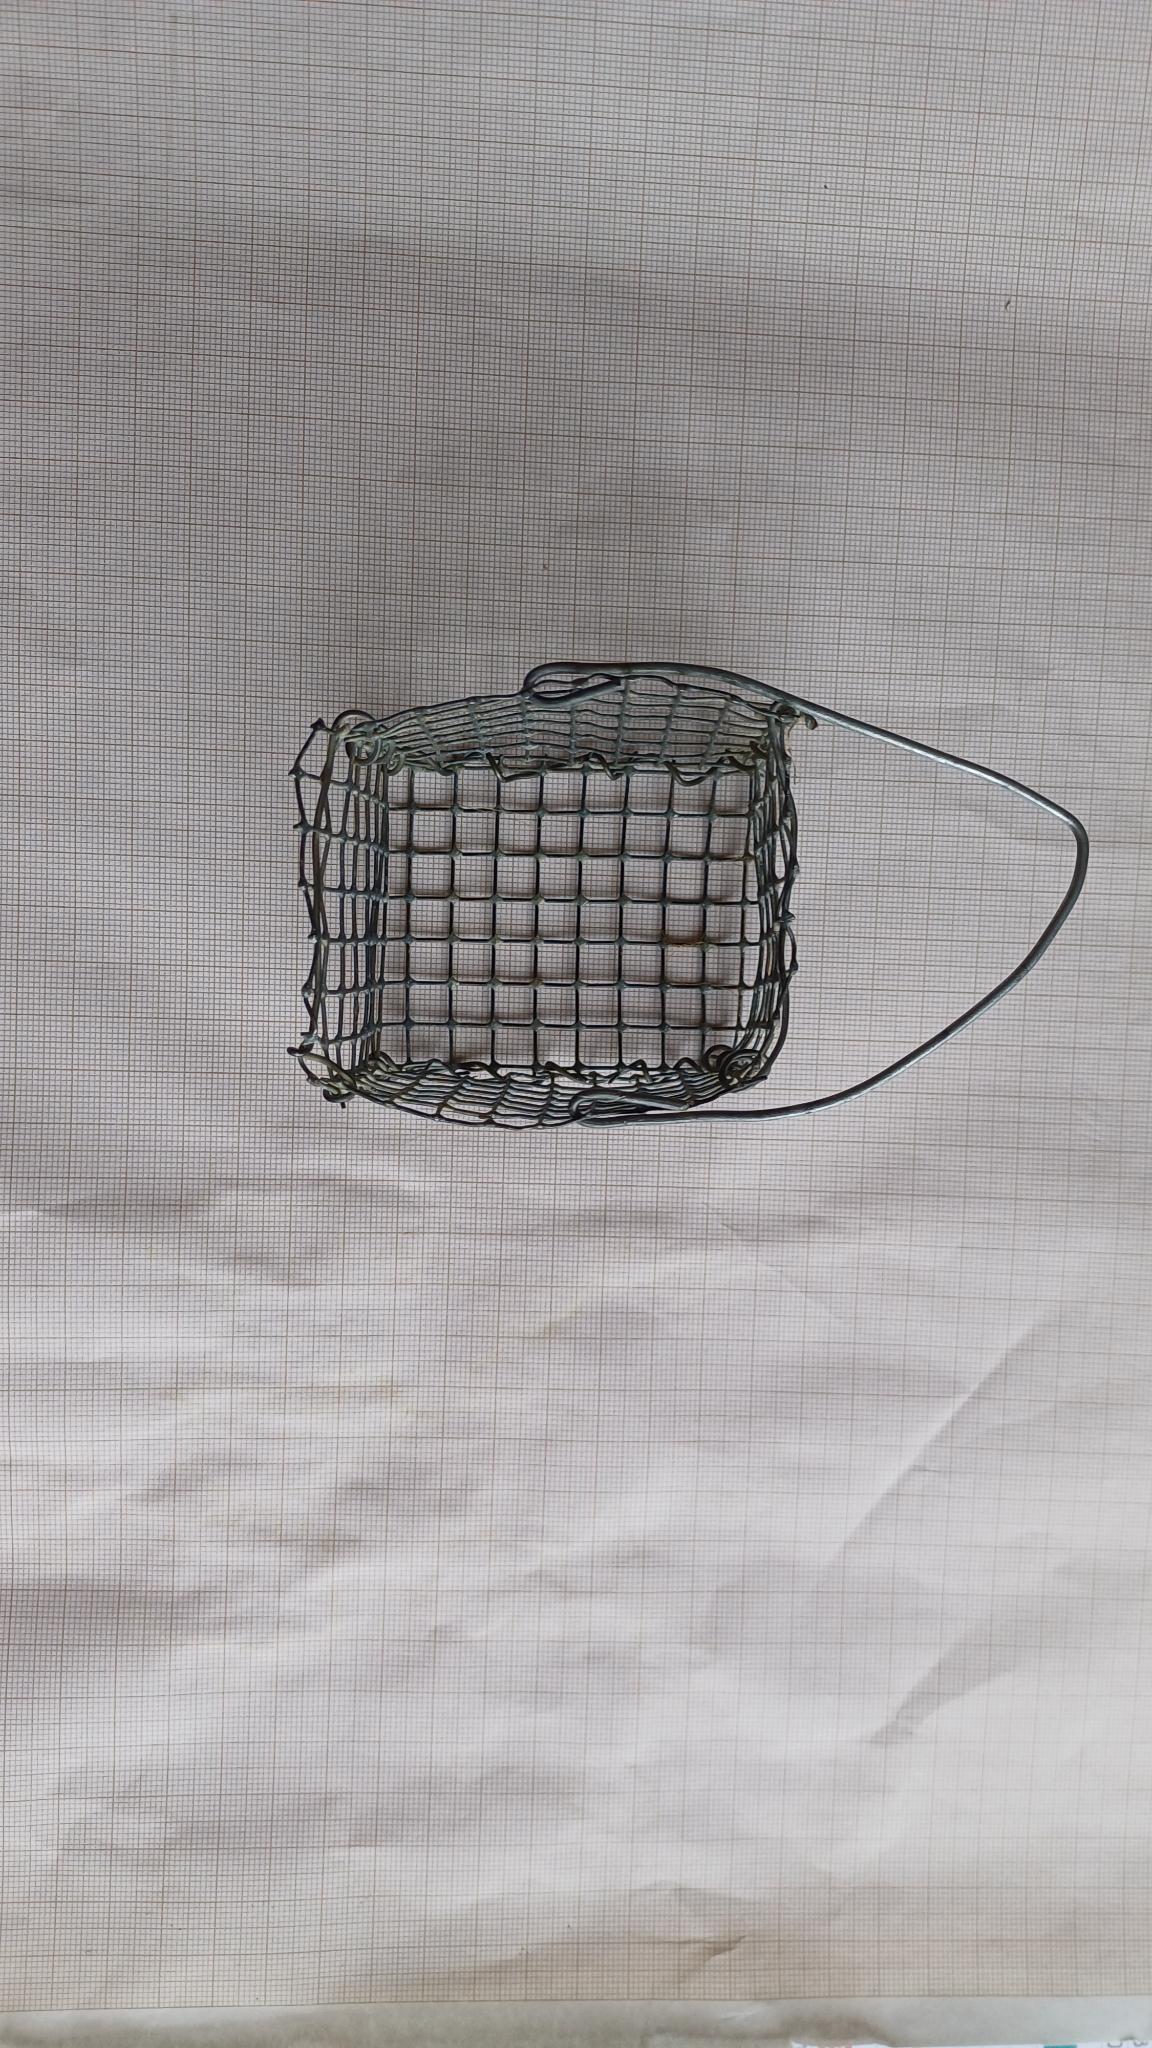
4.4.3.2.2. new
4.4.3.2.3. comparaison
4.4.3.2.4. 3D printed basket
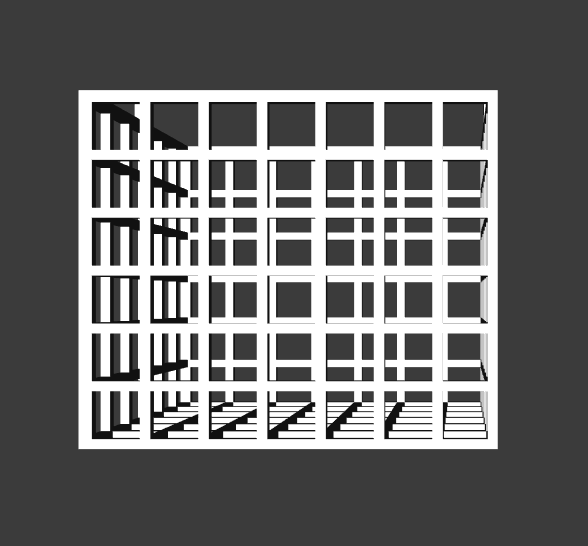
Modélisation 3D : Clément Remont de l'Université Toulouse 3, par l'intermédiaire de Nicole Claverie.
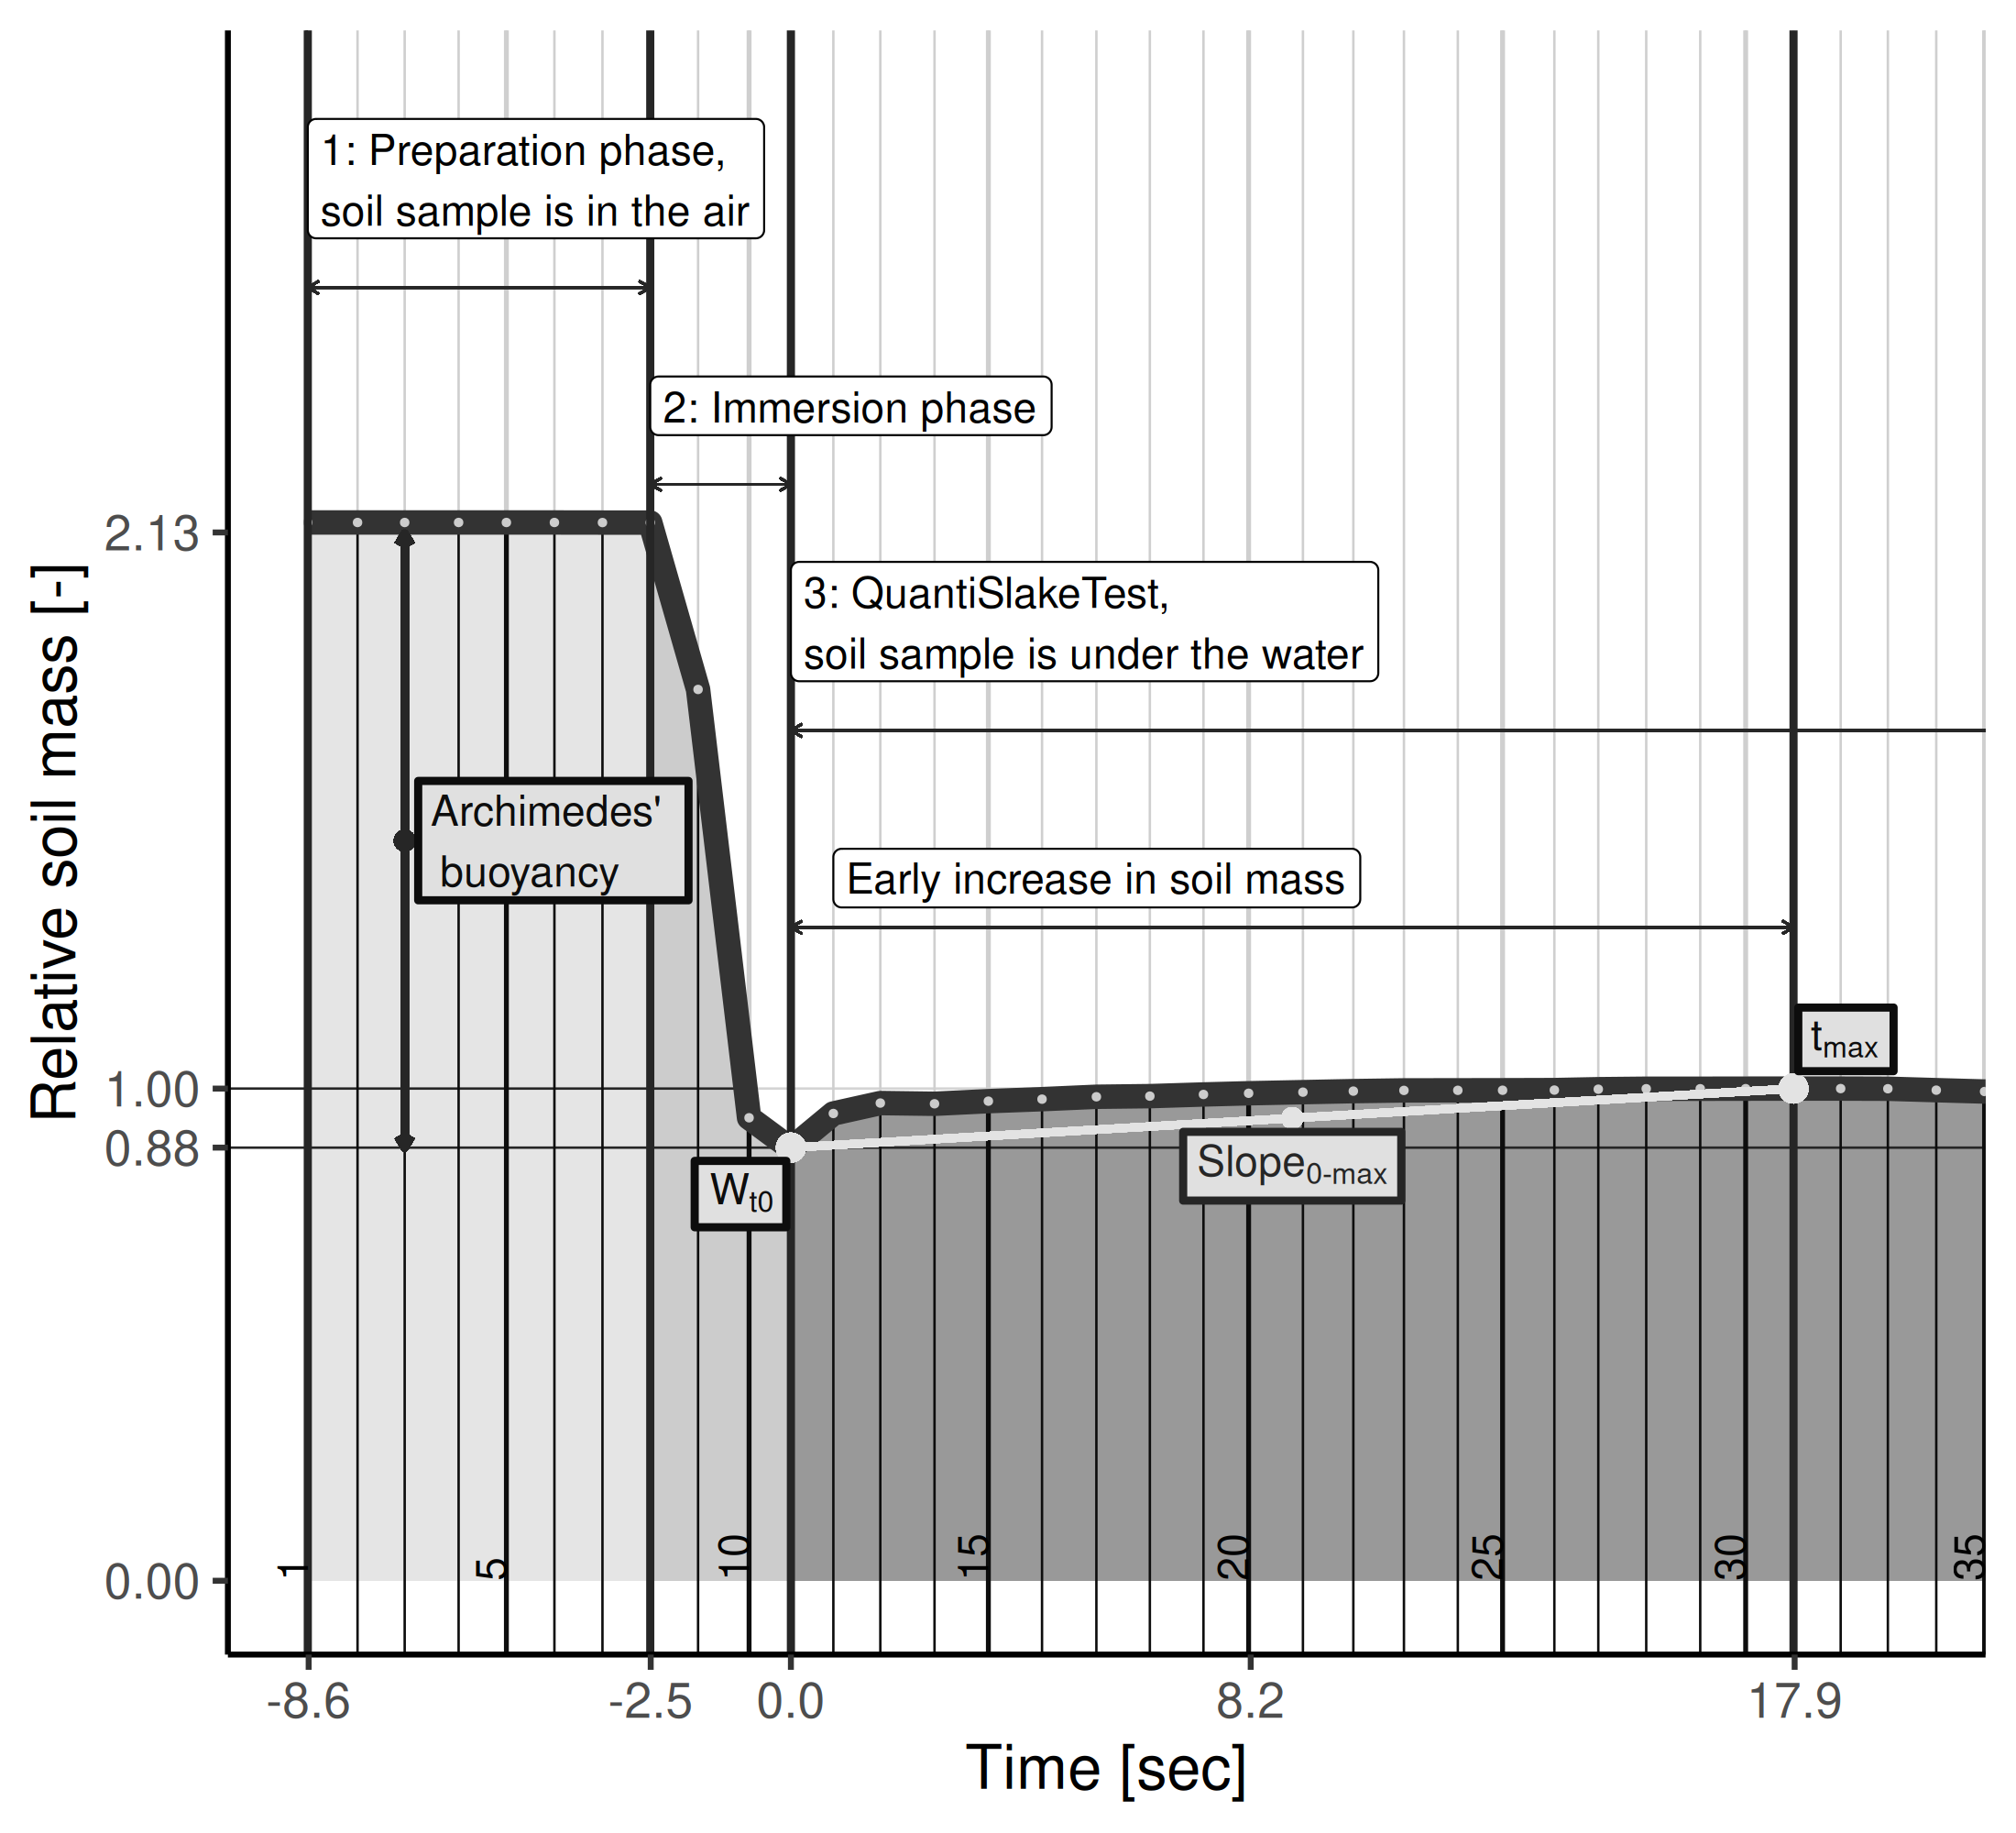
5. What's going in the early phase and main indicators available
5.1. Illustrationof the early phases
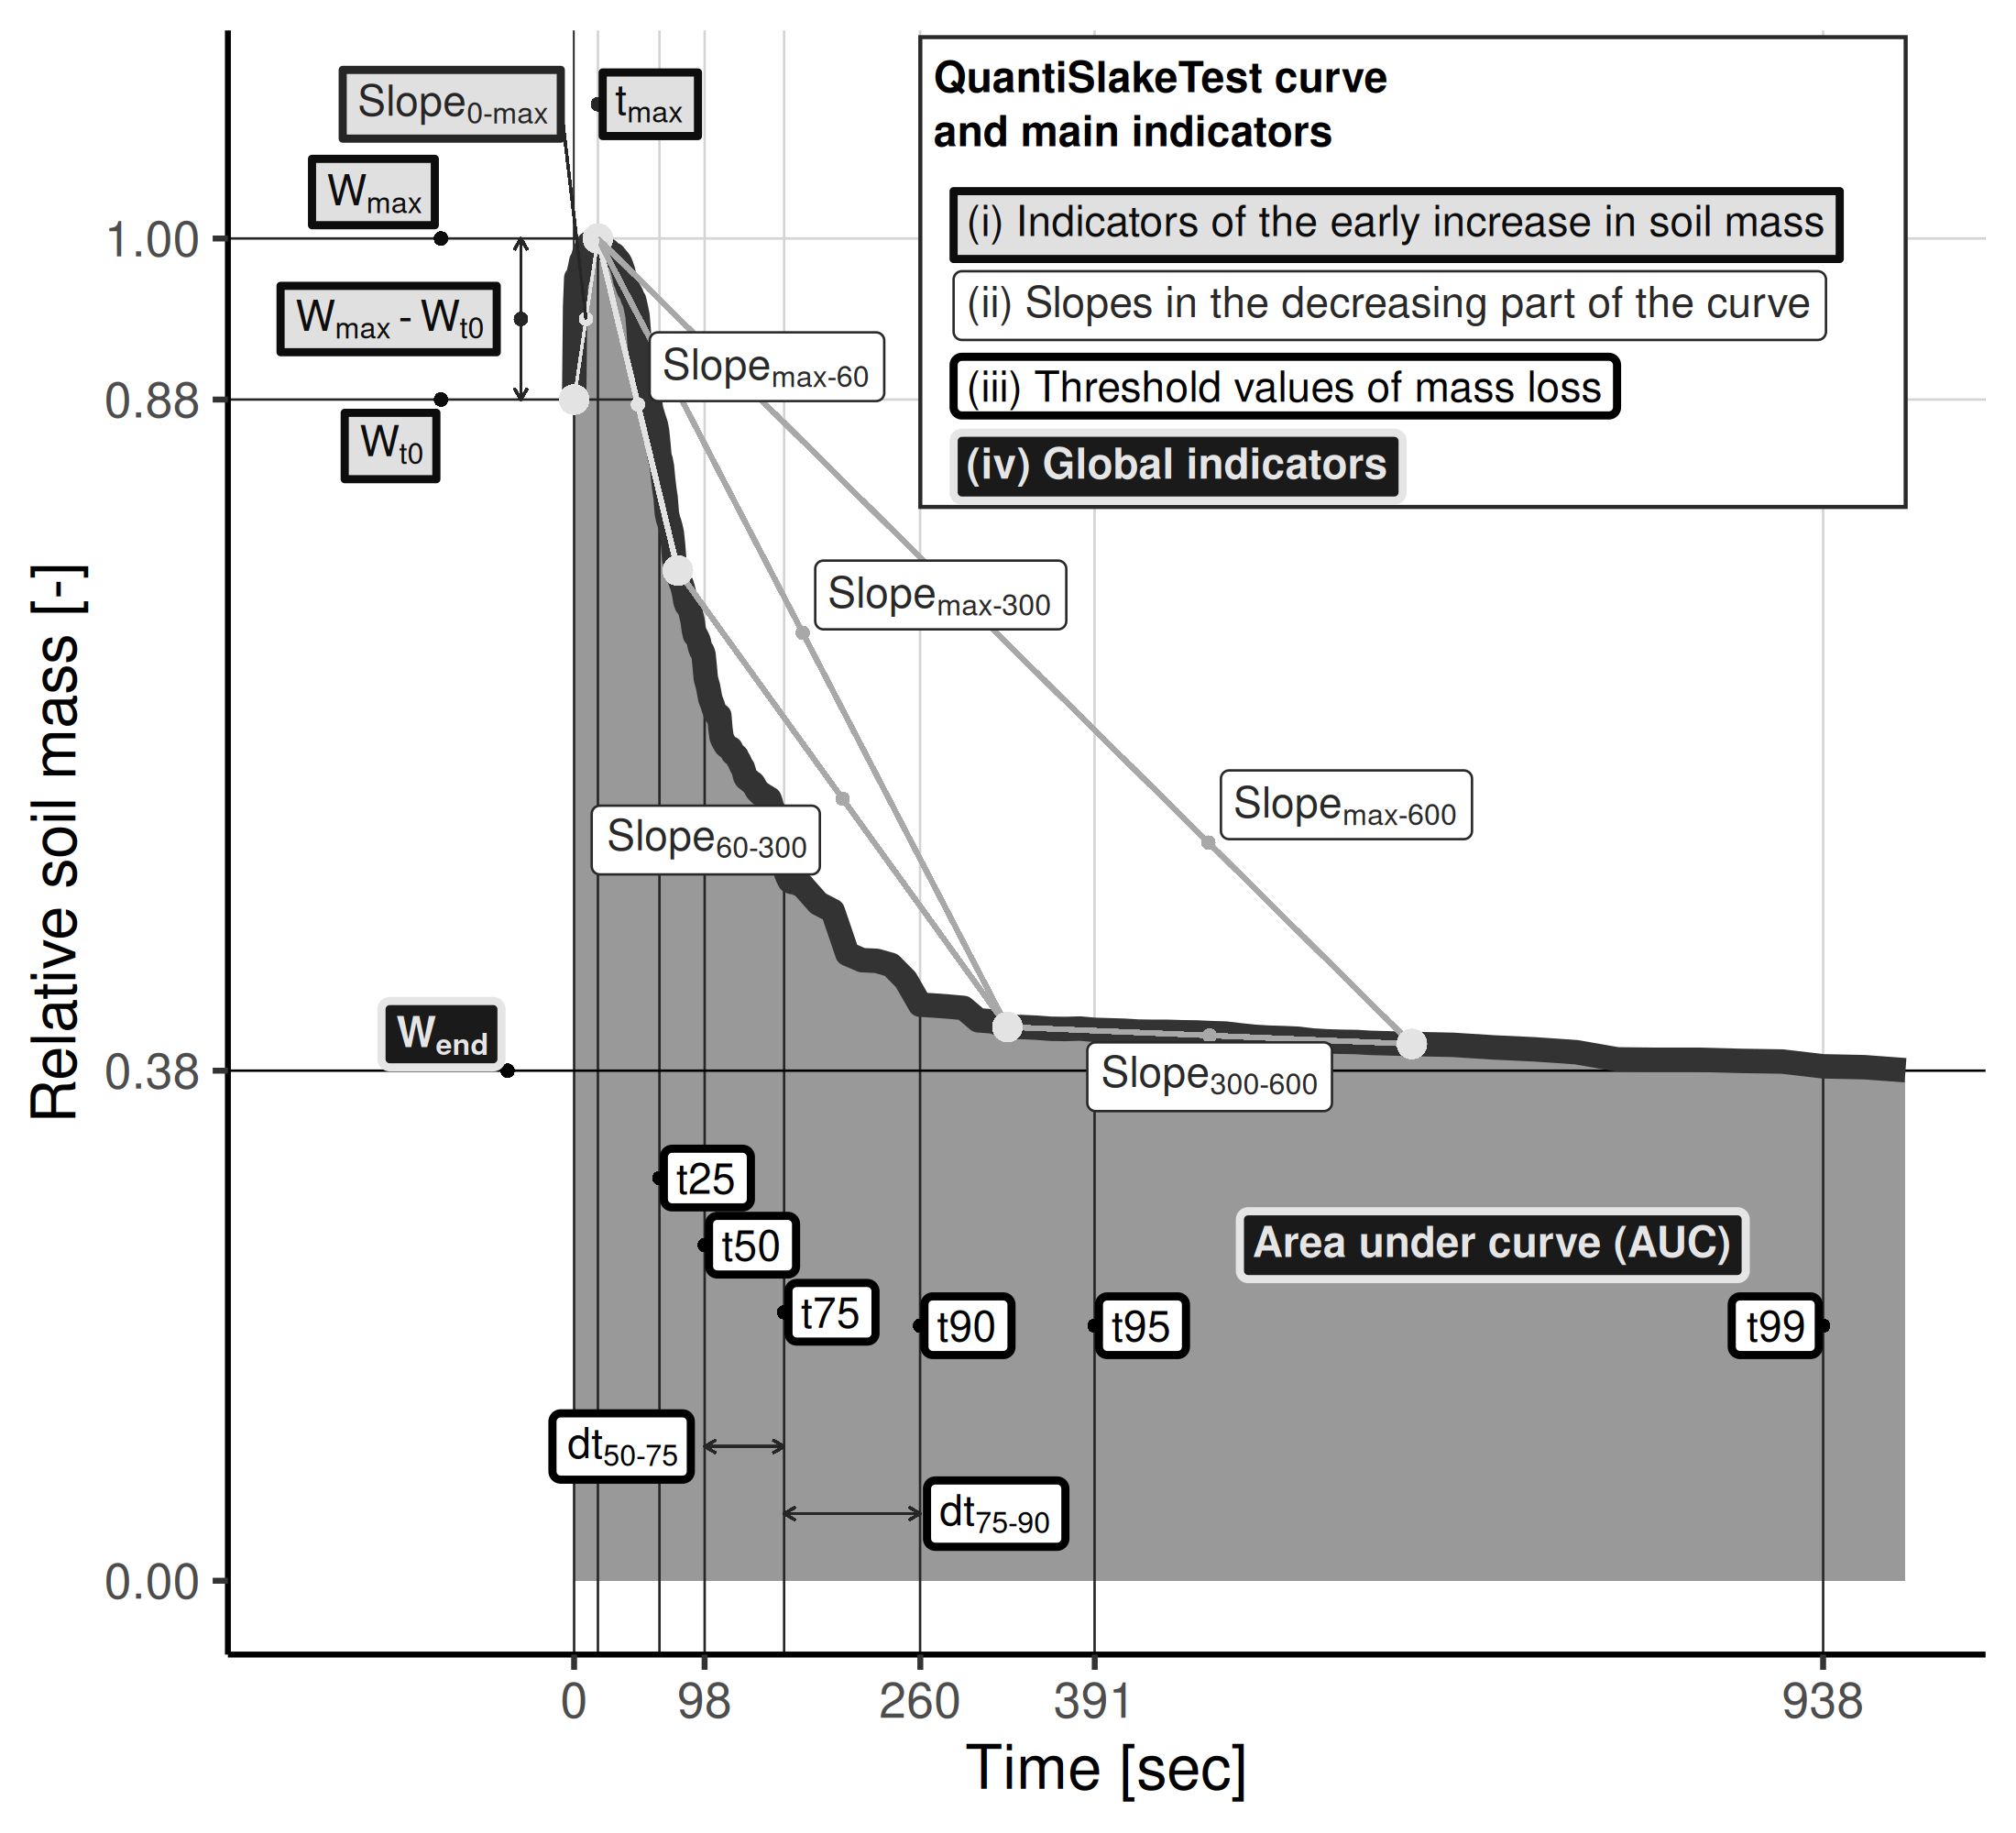
5.2. Main indicators computed
6. Softwares
6.1. R : Slaker
Slaker is the R-packages with functions and web-application for acquiring the data from the scales and for analysing data : computing inicators, plotting curves, …
The package contains lots of functions, but is in a develpment status and is, till now, poorly documented.
It is open-source, instruction for installation and basic usage can be found here :
- Project codes : https://gitlab.com/FrdVnW/slaker
- Project blog (i.e. the web version of the README file) : https://frdvnw.gitlab.io/slaker/dev/
6.2. Python : pySlake vers 1.0 is out !
https://gitrural.cra.wallonie.be/slaker/pyslake
Lien direct pour télécharger le zip-file de la version 1.0 : https://gitrural.cra.wallonie.be/slaker/pyslake/-/archive/vers-1.0/pyslake-vers-1.0.zip
6.2.1. Installation du packages et des dépendances :
Geek zone
pip install git+https://gitrural.cra.wallonie.be/slaker/pyslake.git@main
Dans un terminal, lancer le programme :
Geek zone
python3 $LIEN_VERS_VOTRE_DOSSIER/pySlake/QuantiSnakeTestWeb.py
Programme servi par défaut sur votre http://localhost:8888
6.2.2. Outil pour aider à la configuration de l'ordinateur et de la connectique vers les balances
Geek zone
import serial.tools.list_ports def get_serial_ports(): # Detect available serial ports (Linux or Windows) ports = serial.tools.list_ports.comports() filtered_serial_ports = [port.device for port in ports if not port.device.startswith('/dev/ttyS')] return filtered_serial_ports print(get_serial_ports()) # Print the line
Download the Python script for listing serial
Geek zone
import serial ser = serial.Serial('/dev/ttyUSB0', 9600, timeout=1) while True: line = ser.readline() # Read a line from the serial port print(line.decode('utf-8').strip()) # Print the line ser.close()
8. Vidéos
8.1. Soil slaking and curves building : illustrative comparisons
- New version (french) Wheat after Grasslands or Industrial crops : https://youtu.be/VETSN8XmmuY?si=d9Do4QY320BXoVUr
- New version (french) Wheat after Grasslands or Industrial crops (To be
- Old version Full Inversion Tillage / Reduced Tillage : https://youtu.be/G9UweThvHYI?si=jtHcYsBVZSGSshQ-
8.2. Protocol / lab explanation (french) :
8.3. Take a soil sample at home / at farm :
(N.B. Almost all for live slaking during fairs, festivals, conferences, …)
8.4. Main youtube channel :
8.5. Social media
9. Partners
9.1. Farmer's association
9.1.1. Greenotec
9.2. Academic
9.2.1. UCLouvain
9.2.2. ULB
9.2.3. ULg/GbxABT
9.2.4. HEPN
9.2.5. ISIA/Huy
9.3. Projects
9.3.1. PIRAT, F.Vanwindekens (initial development of the experiment & protocol)
9.3.2. MicroSoilSystem, B.Hardy, (farmers' network)
9.3.3. Sol Plateformes (Gembloux), B.Hardy, S.Sail, M.Abras (SYCI, SYCBIO, SYCMA)
9.3.4. Sol LTE (Gembloux), S.Sail, B.Hardy,
9.3.5. SPOT (Libramont), M.Mathot
9.3.6. AgroEcologyTransect, A.Fockedey
9.3.7. Wallonie Agriculture de Conservation (WAC), M.Ferdinand (farmers'network)
9.3.8. Erosion Betterave (EroBet), Greenotec Team (farmers'network)
Bibliographie